Understand structural dynamics through modal shapes

Extract modal frequencies and shapes directly from synchronized sensors
The Modal Analysis Tool computes the dynamic response of structures using synchronized wireless accelerometers—extracting modal frequencies, vibration modes, and changes in structural stiffness without the need for external software or manual processing.
Ideal for:
- Bridge spans and viaducts
- Towers and high-rise buildings
- Heritage assets and large halls
- Any structure exposed to dynamic loads (traffic, wind, machinery)
Structural analysis outputs
The Modal Analysis Tool processes synchronized acceleration data from multiple wireless sensors to compute and visualize structural response indicators—across all axes and all detected modes.
Frequency overview (X,Y,Z)
Visual summary of all modal frequencies detected across longitudinal, transversal, and vertical directions—displayed per axis and per sensor group.
Frequency statistics
Modal frequency distribution across the sensor group. Highlights dominant modes, consistency, and deviation patterns for comparative structural analysis.
Frequency trend over time
Track how specific modal frequencies evolve throughout different campaigns, allowing correlation with structural interventions or evolving degradation.
Modal shape 3D view
Visualizes the full 3D modal shape for each detected mode—reconstructed by combining data from all sensors in the network.
Modal shape 2D slices
Displacement profiles of each modal shape, separated by axis: longitudinal, transversal, and vertical. Useful for isolating directional behaviors.
Displacement trend by shape
Displays the displacement of structural movement associated with each modal shape over time, helping identify mode-dependent stiffness loss or resonance effects.
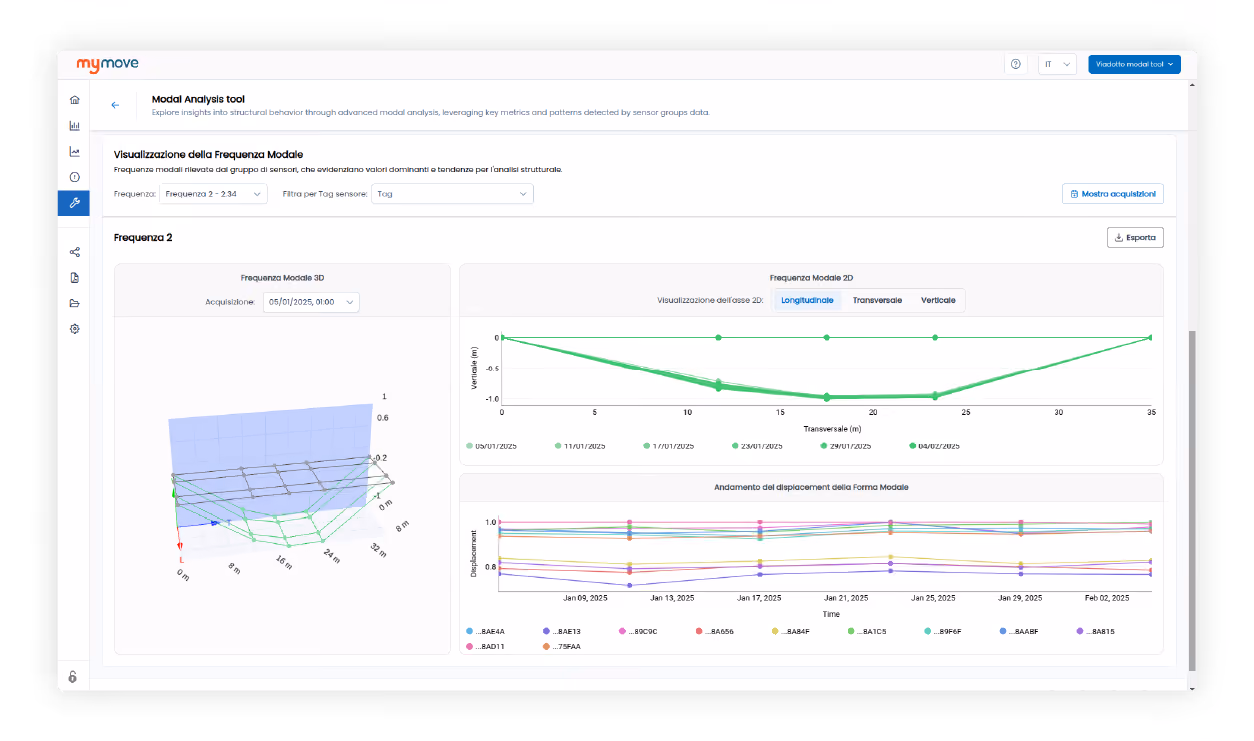
3D visualization of Modal Shapes
The core of the Modal Analysis Tool is the 3D representation of each identified modal shape. Based on synchronized acceleration data collected over a selected time window, the platform reconstructs the dynamic deformation profile of the structure for each modal frequency detected.
Each modal shape is displayed as a spatial 3D displacement pattern (in millimeters), computed from the relative motion of the accelerometers used in the analysis. This representation enables engineers to assess how different parts of the structure move together or decouple under dynamic excitation, revealing structural behavior patterns such as torsion, vertical flexure, or transverse oscillation.
Engineers can apply user-defined tags to filter sensor subgroups and isolate specific structural segments or behaviors. This selective visualization helps distinguish local anomalies from global responses and supports a more targeted interpretation of complex modal shapes.
2D visualization and Modal displacement trends
To complement the 3D view, the Modal Analysis Tool offers 2D sectional visualizations of each modal shape. The same frequency mode is visualized in longitudinal, transversal, or vertical planes—making it easier to interpret motion patterns that would be difficult to read in full 3D.
Each plane emphasizes a specific deformation direction, enabling engineers to isolate axial, lateral, or vertical components of the structure’s dynamic behavior.
Additionally, the platform provides Modal Shape Displacement Trends, which show the displacement (in mm) of each accelerometer contributing to the shape, tracked over the duration of the campaign. This helps quantify the spatial contribution of each sensor and evaluate whether the dynamic behavior remains consistent over time.
Modal Frequency Statistics and Dominant Mode Trends
The tool extracts and aggregates all modal frequencies detected within the time interval analyzed. This statistical view provides a frequency spectrum for the entire structure, indicating how often specific frequencies recur, and whether any mode shows significant deviation or shift.
The dominant modal frequencies—those most frequently identified with significant energy—are automatically highlighted. These can indicate the primary modes of vibration under operational conditions, and any shift in their value over time may suggest changes in stiffness, boundary conditions, or mass distribution.
Trends in frequency variation are essential for assessing long-term structural evolution, especially when comparing campaigns before and after critical events (e.g. seismic shocks, retrofitting interventions, or damage).
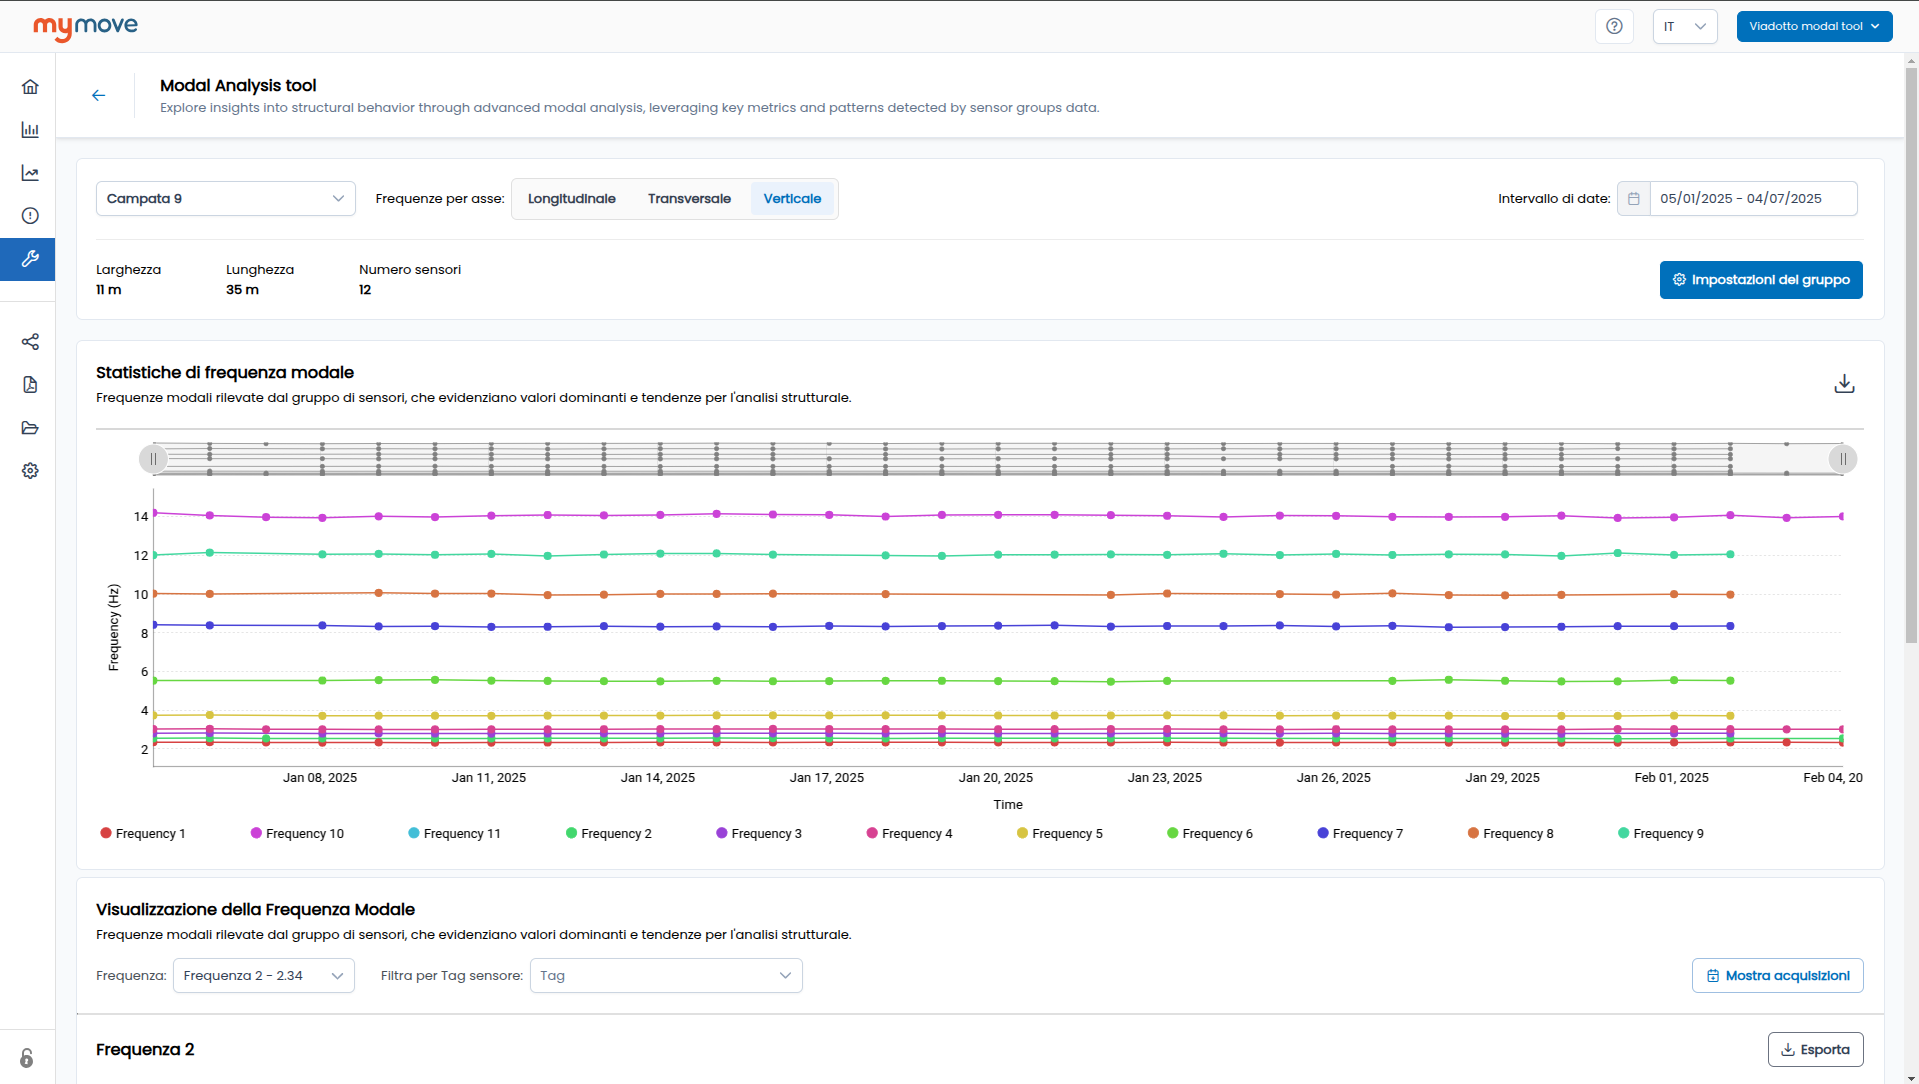
Sensor group configuration and network settings
Advanced sensor group configuration is a key feature of the tool. Engineers can define custom sensor networks by selecting specific accelerometers deployed on the structure and organizing them into logical groups for modal computation.
Each group can be visualized in the tool’s sensor layout map, which includes the position and 3-axis orientation of every device.
This level of control is essential for ensuring data consistency across repeated analyses and for obtaining reliable, comparable results in complex structures. Proper orientation and grouping improve mode shape resolution, reduce noise, and allow multi-event comparisons within the same structural model.
.avif)
Book a live demo with our team
Discover how our platform collects data, manages your sensors remotely, and delivers structural insights—live, in one call.
Where it can be used
Bridges and viaducts
Identify changes in stiffness and natural frequencies to detect early signs of fatigue, cracking, or progressive degradation in span structures.
Towers and masts
Evaluate dynamic response and natural vibration modes in telecommunication towers, chimneys, or transmission masts under wind or operational loads.
Industrial atacks and silos
Monitor modal frequencies and damping behavior in tall industrial structures to ensure structural performance and safety compliance.
Heritage and masonry structures
Assess dynamic behavior of historical buildings and bell towers to monitor evolution of cracks and structural vulnerability over time.
Railway bridges
Analyze modal response of bridges and viaducts under train loads to detect stiffness variation or rail-structure interaction issues.
Wind turbine towers
Measure operational modal response under wind loads to identify changes in dynamic characteristics that may indicate mechanical or structural anomalies.
Footbridges and pedestrian structures
Monitor frequencies and damping to evaluate comfort criteria and detect possible resonance risks due to pedestrian-induced vibrations.
Temporary installations
Validate structural integrity and detect evolving weaknesses in temporary steel structures, scaffolding, or shoring systems under dynamic loads.

Fully integrated into MyMove
All computations are embedded directly in the MyMove platform, without requiring any data export, scripting, or external software.
Accelerometer data is ingested, aligned, and processed automatically—delivering high-value modal insights to your dashboard.

newsletter
Stay updated on product releases, news, and upcoming webinars.