From tilt angles to spatial deformation profiles

Structural deformation mapped with engineering accuracy
The Tiltmeter Chains Tool transforms raw tilt angle data from wireless tiltmeters into precise spatial displacement profiles. Engineers can track deformation along entire chains of sensors, enabling accurate evaluation of structural behavior over time.
Ideal applications include:
- Retaining walls
- Tunnel linings
- Façades
- Temporary excavation support systems
Structural analysis outputs
The tool converts synchronized tilt measurements from multiple tiltmeters, arranged in vertical or horizontal chains, into:
Vertical displacement profiles
Compute cumulative vertical movement from angular variation across horizontal chains. Ideal for tracking settlement or heave in tunnel linings, embankments, or buried structures.
Longitudinal deformation profiles
Visualize axial deformation along vertical chains, revealing bending, creep, or settlement in façades, walls, or piles over time.
Transverse deformation profiles
Extract horizontal lateral movement trends in vertical chains—used to detect bowing, rotation, or failure mechanisms in retaining walls or deep excavations.
Differential trends
Calculate relative displacement between adjacent tiltmeters (segment-by-segment) in any orientation. Useful for detecting local distortions or non-uniform behavior.
Absolute displacement profiles
Combine baseline geometry and tilt angles to reconstruct full spatial deformation profiles referenced to a fixed origin—especially effective when anchor points are available.
Time-series graphs
Visualize trends of angular variation and derived displacement, enabling engineers to correlate deformation trends with time, loading, or environmental events.
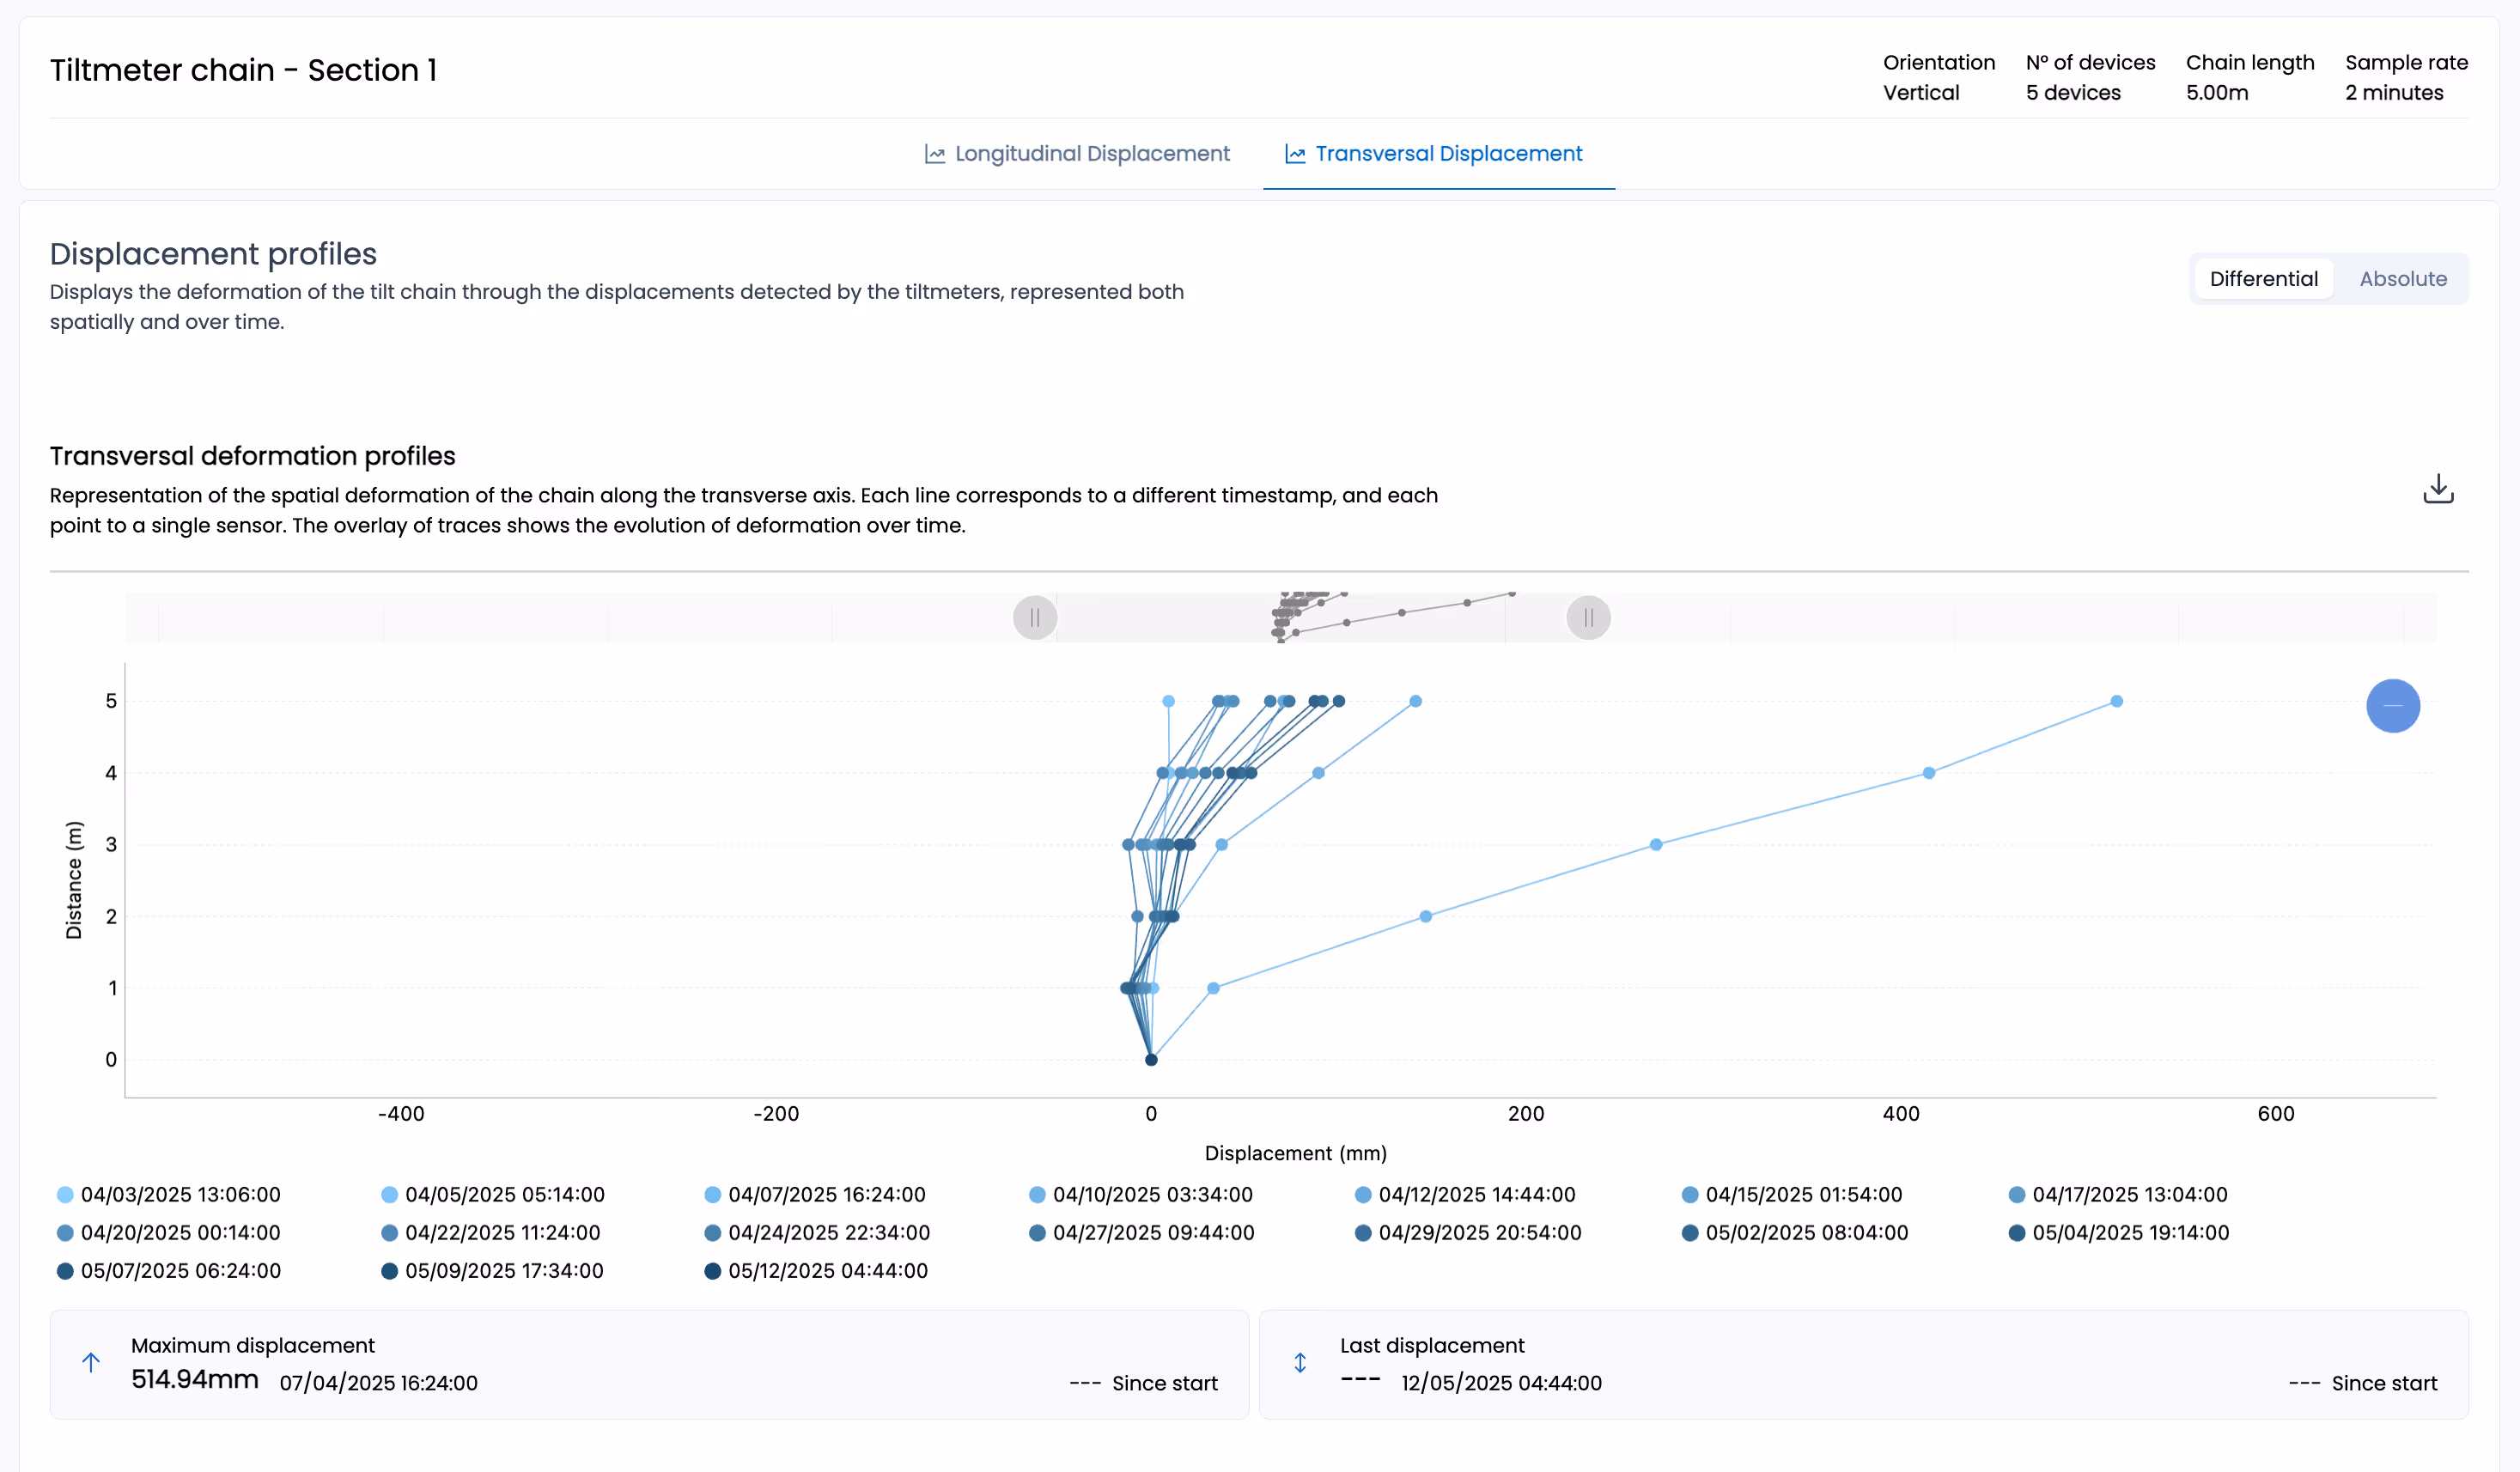
Longitudinal and Transversal spatial deformation profiles
The Tiltmeter Chain Tool enables the computation of high-resolution horizontal deformation profiles—both longitudinal and transversal—using a series of wireless tiltmeters deployed in vertical chains.
These profiles are calculated from the tilt angles measured along the height of the chain and converted into spatial displacement values (in millimeters). The result is a precise reconstruction of how the structure deforms laterally, either in the direction of the wall’s length (longitudinal) or perpendicular to it (transversal).
This type of analysis is essential for evaluating structural behavior in retaining walls, tunnel linings, diaphragm walls, and façades, where horizontal bowing, convergence, or lateral instability must be quantified and tracked.

Vertical spatial deformation profiles
When tiltmeters are installed horizontally—along a slab, beam, or deck—the Tiltmeter Chain Tool computes vertical displacement profiles. These profiles indicate changes in vertical alignment across the monitored segment, revealing behaviors such as deflection, settlement, uplift, or sagging.
Vertical deformation analysis is particularly relevant for bridge decks, tunnel roofs, long-span structural elements, and temporary excavation supports, where monitoring relative vertical movement is critical to ensuring performance and safety.
Displacement is calculated in millimeters from tilt data and translated into vertical offsets between adjacent sensors, producing a curve that represents the bending or displacement profile of the monitored segment.
Displacement trend charts over time
For every spatial profile—whether longitudinal, transversal, or vertical—the platform also provides time-series trend graphs showing the evolution of displacement for each tiltmeter in the chain.
These charts allow engineers to:
- Evaluate deformation progression over timeIdentify sudden shifts or accelerations
- Compare displacement behavior between sensors
- Distinguish between localized movement and global trends
Each graph is directly linked to the sensor layout and profile view, ensuring seamless correlation between spatial deformation and its temporal development.

Absolute and Differential measurement modes
All deformation profiles and time-series graphs in the Tiltmeter Chain Tool support both absolute and differential views.
- Absolute values represent the raw tilt angles measured by each device, referenced directly to the gravitational axis. This mode shows the true inclination of each sensor relative to vertical or horizontal orientation.
- Differential values are computed by subtracting the initial tilt reading from each subsequent measurement. The initial reference (T₀) can be set by the user at any time—typically at installation or after a structural reset—allowing the visualization of relative displacement and deformation with respect to a known baseline.
Differential mode is essential for assessing changes in structural geometry over time, as it isolates the net movement of the structure from the initial condition and filters out construction tolerances or pre-existing misalignments.
Both views can be toggled in real time from the dashboard and are available for all output charts and profiles, providing engineers with maximum flexibility in data interpretation.
Book a live demo with our team
Discover how our platform collects data, manages your sensors remotely, and delivers structural insights—live, in one call.
Application areas
Retaining walls
Monitor progressive deformation and rotation along the wall height to assess long-term stability and detect failure mechanisms.
Tunnels and linings
Track structural bowing and convergence in tunnel linings—both horizontal and vertical—for early detection of ground-induced stresses.
Façades and heritage buildings
Evaluate angular shifts and differential displacement in historic façades, bell towers, and masonry walls.
Bridge piers and abutments
Measure tilting and lateral drift in bridge supports to identify foundation instability or localized deformation.
Deep Excavations and Diaphragm Walls
Control lateral displacements in diaphragm walls or pile walls during excavation phases.
Embankments and slopes
Analyze cumulative tilting and displacement in embankments and slopes subject to settlement, creep, or landslide risk.
Silos and vertical structures
Monitor vertical deformation profiles in industrial towers, silos, or chimneys.
Wind turbine foundations
Track tilt behavior in wind turbine foundations to identify structural anomalies.

Fully integrated into MyMove
The Tiltmeter Chain Tool eliminates the need for manual calculation, spreadsheets, or external scripts. Every calculation is embedded into the MyMove platform—ensuring engineers can access real-time, field-ready deformation insights without leaving the dashboard.

newsletter
Stay updated on product releases, news, and upcoming webinars.