
Your AI assistant for structural data
Move Intelligence is the AI-powered layer inside MyMove that lets engineers query complex monitoring datasets using natural language.

Visualize. Analyze. In seconds.
Generate charts, summaries, and structured answers instantly — without exports, manual filtering, or external tools.


Describe what you need, get a chart in seconds
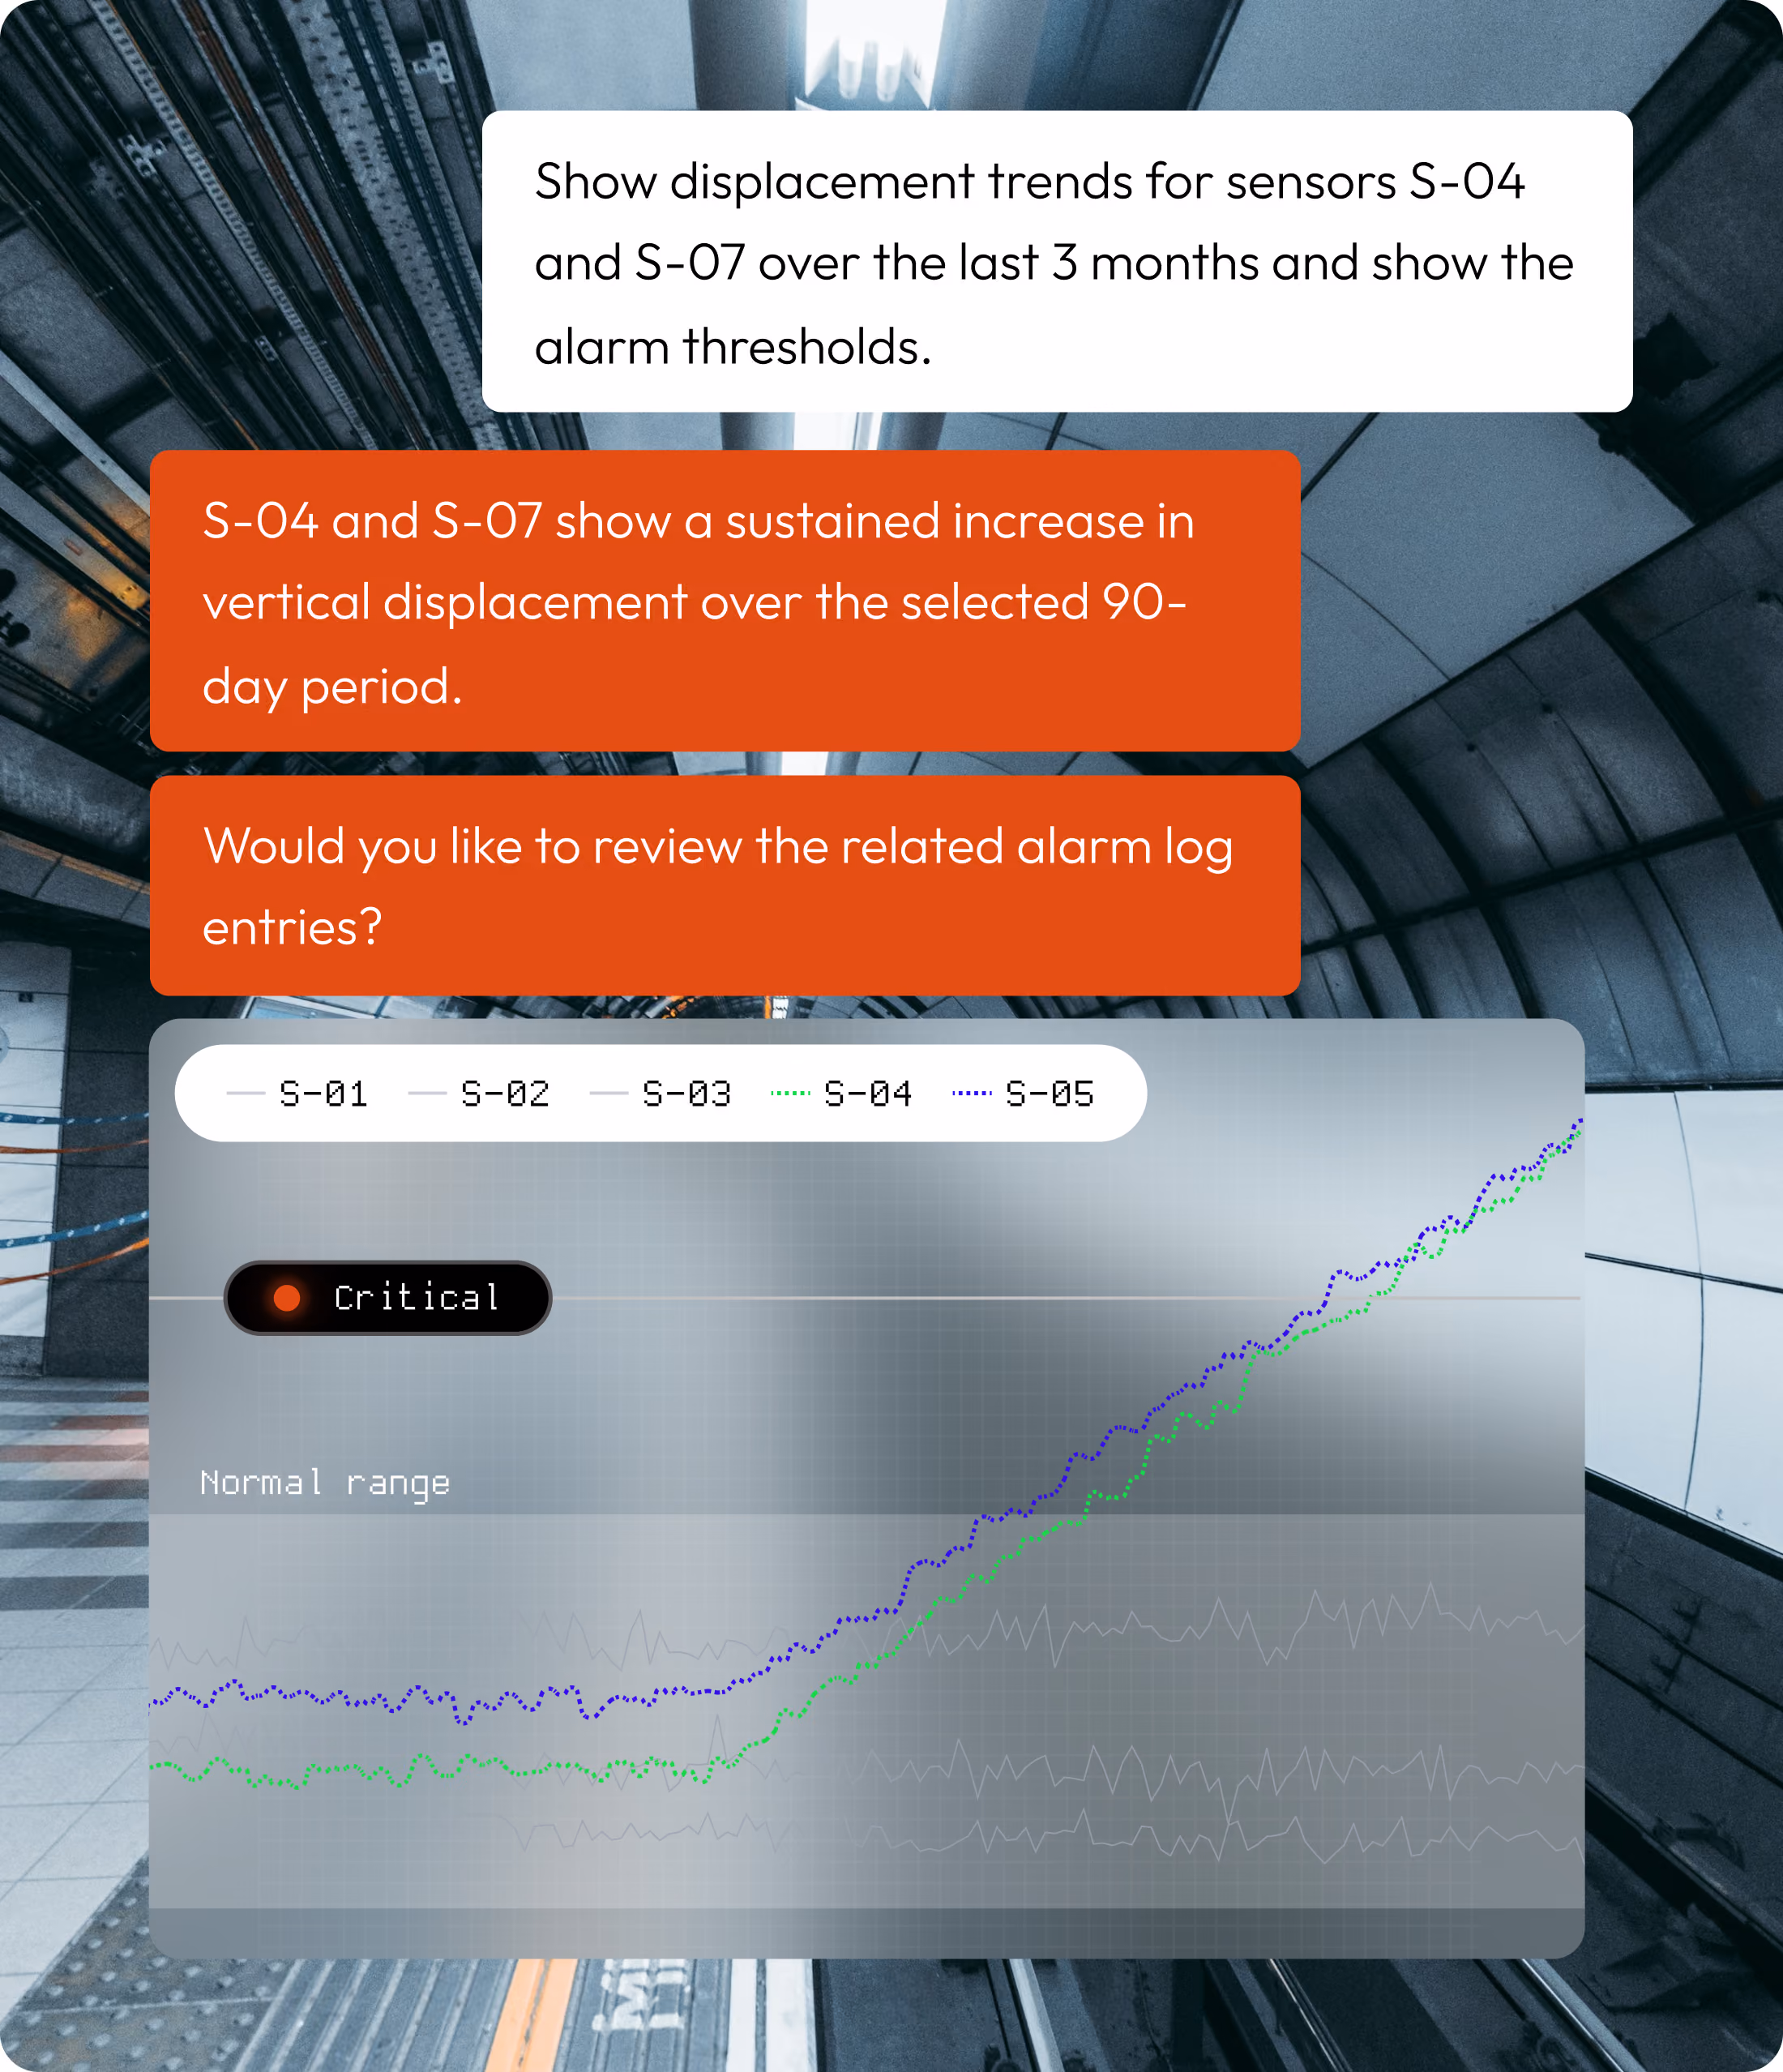
- Natural language requests: Describe your chart like you'd explain it to a colleague. Move Intelligence interprets your request and builds it.
- Automatic data selection: Relevant sensors, parameters, and time ranges are identified automatically based on context.
- Save and reuse: Any chart you create can be saved to your dashboard or added to reports.

Accelerate engineering analysis
- Comparative trends: Compare multiple sensors, parameters, or time periods without manual chart.
- Parameter extraction: Retrieve maximum, minimum, and variation values across selected datasets instantly.
- Correlated visualization: Overlay structural and environmental parameters to support deeper analysis.

Know what's happening across your entire project
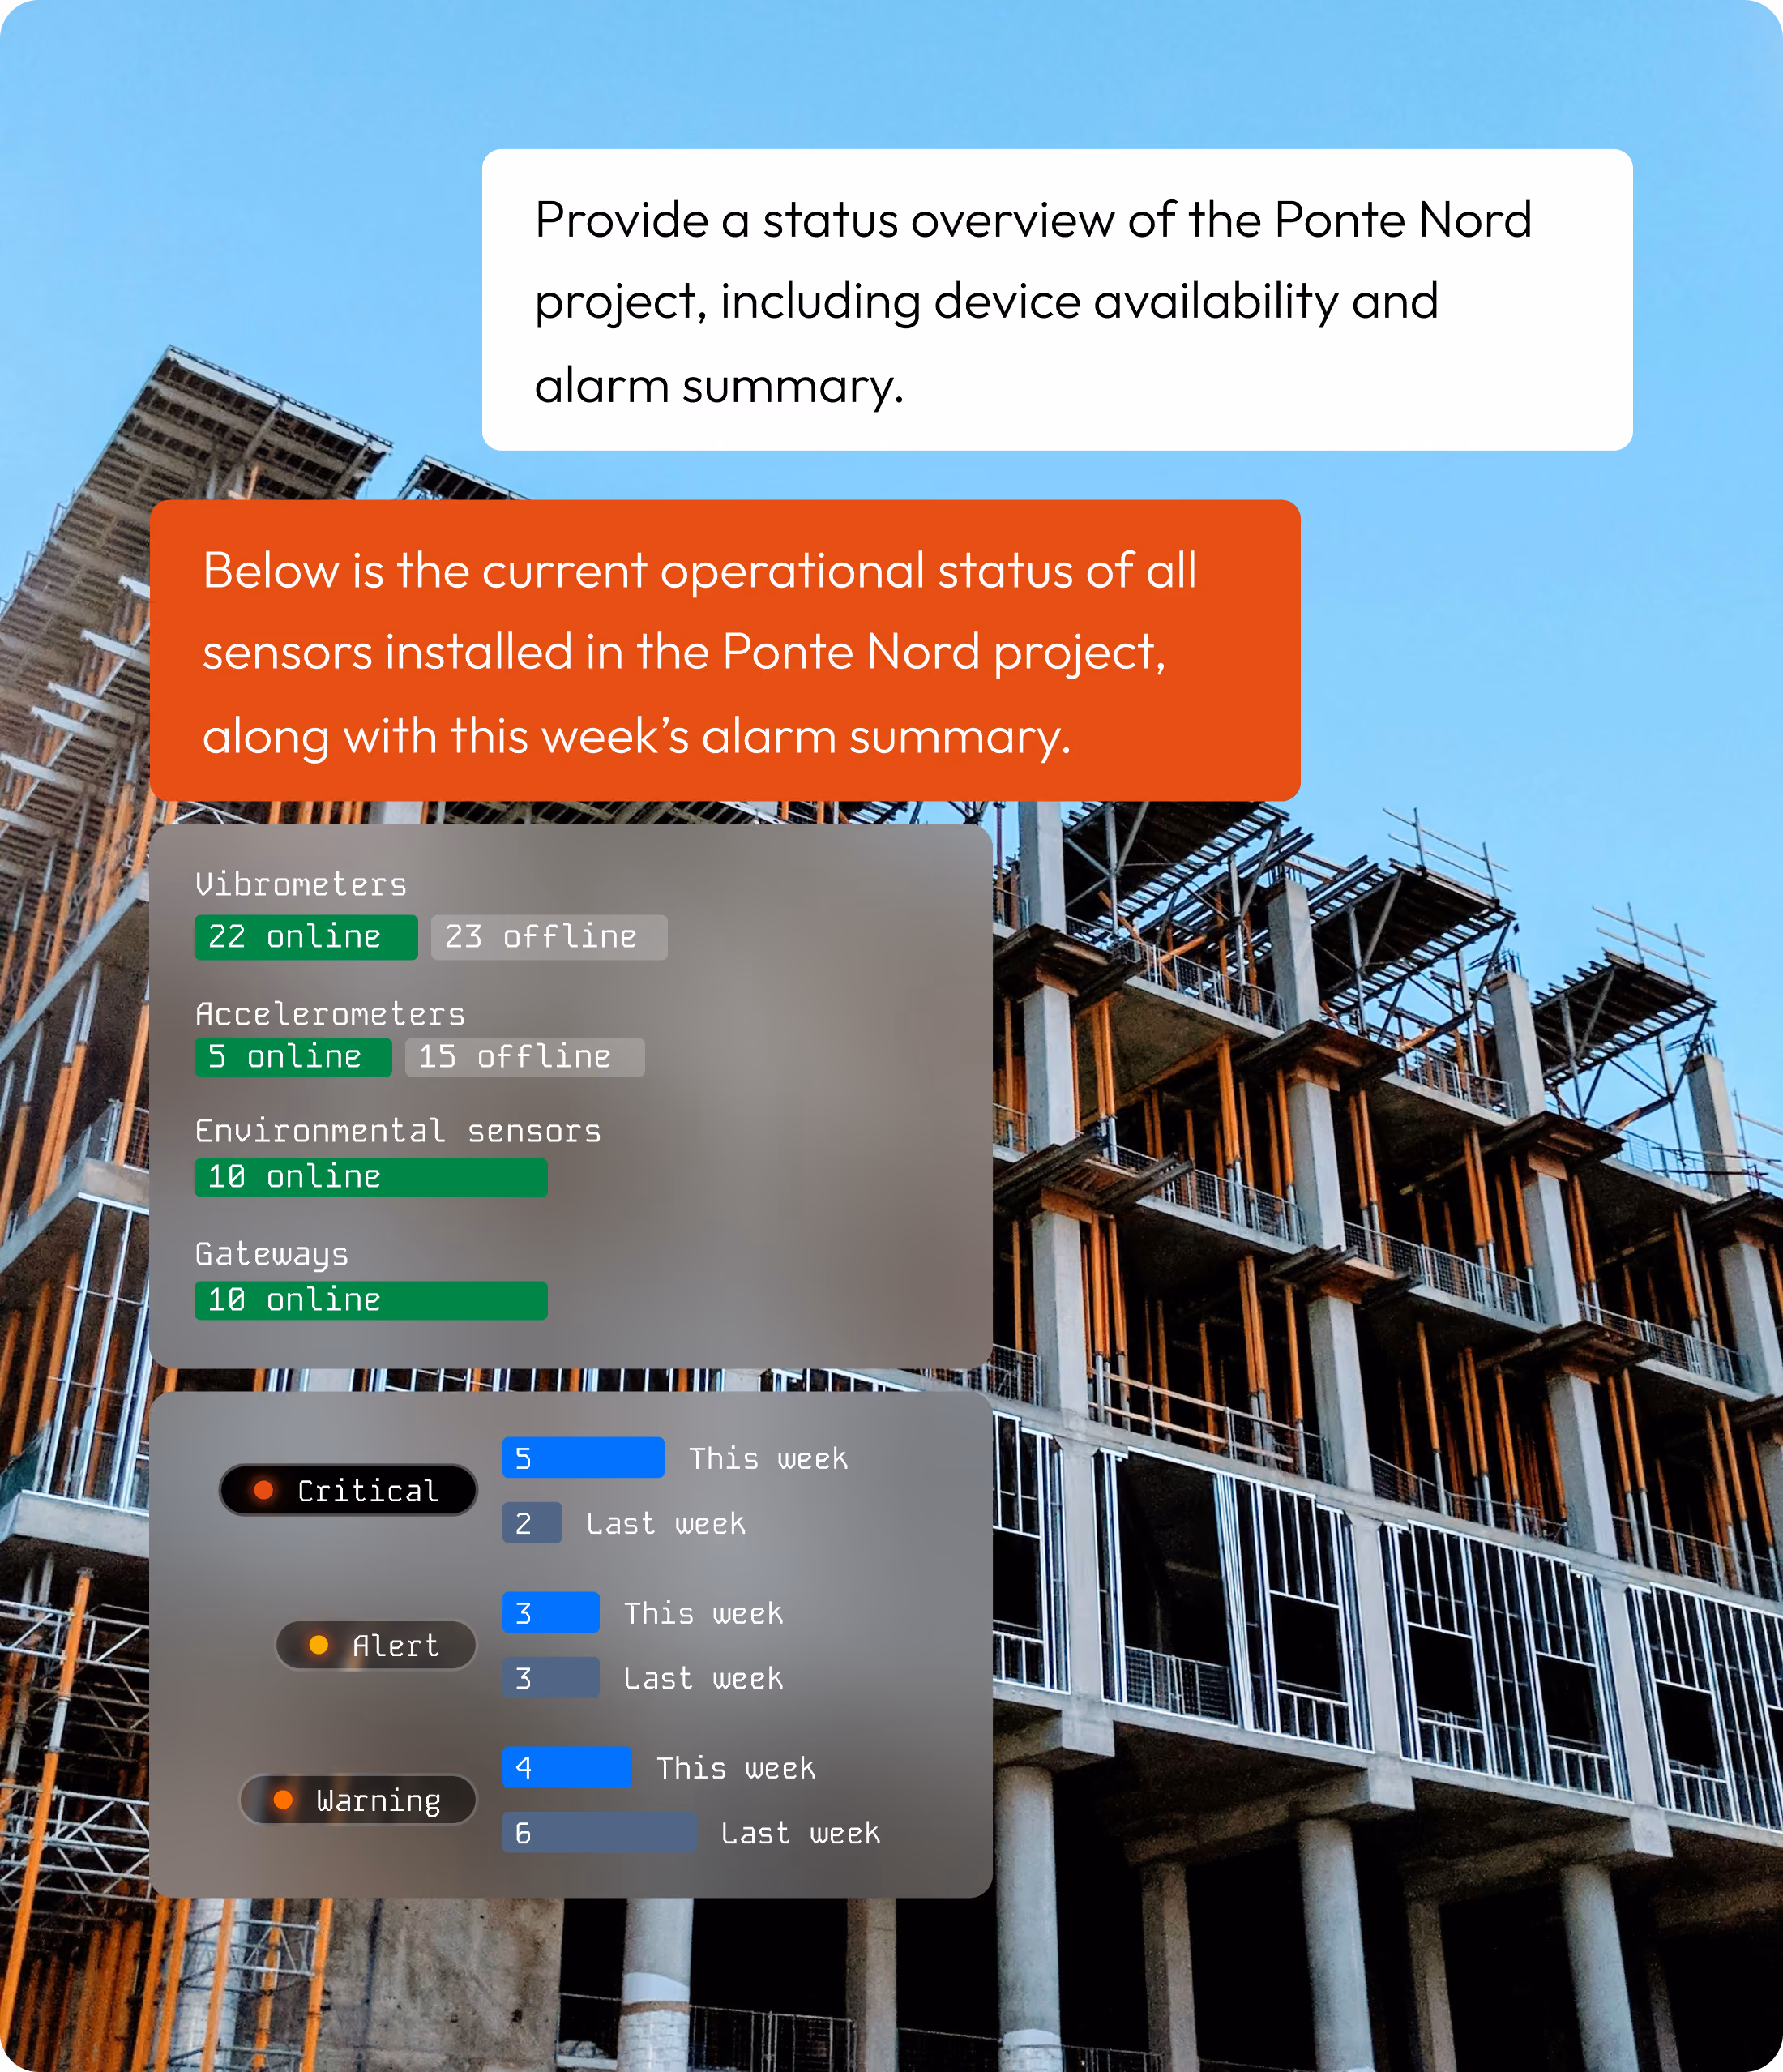
- Automated device oversight: Ask, don't search. Get a structured summary of your sensor connectivity and reporting status instantly, reducing the time between data collection and decision-making.
- Instant alarm summaries: Stop scrolling through logs. Instantly query this week's triggers or analyze historical events grouped by device or sensor type, in seconds.
All your advanced analysis tools. One environment.

Modal analysis
Extract frequencies, damping, and mode shapes from synchronized accelerometers. Visualize 3D deformation patterns across your structure. Track how modal behavior changes over time and catch stiffness loss early.

Tiltmeter Chain
The Tiltchain Tool provides detailed deformation profiles and displacement trends by analyzing angular variations along chained tiltmeters — ideal for tracking structural movement over time.
See MyMove in action
Book a 20-minute demo with our experts and discover how MyMove can unify all your monitoring data—wireless and third-party—into one intelligent platform.