Understand static behavior through deflection profiles
Turn the data your tiltmeters generate during load tests into deflection profiles and displacement trends you can compare over time
Map structural deformation
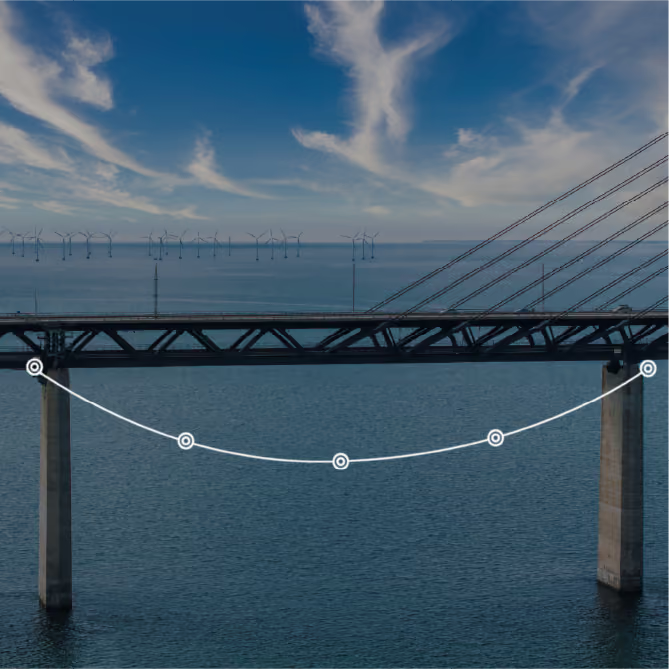
Generate the curvature profile of a static deflection for a span or deck from a group of wireless tiltmeters. Overlay profiles from different timestamps to evaluate repeatability, symmetry, and stiffness variations. Start a new analysis at any time by changing the zeroing timestamp, and keep results comparable even when tests are months apart or when sensors are moved to another span.
Structural analysis outputs

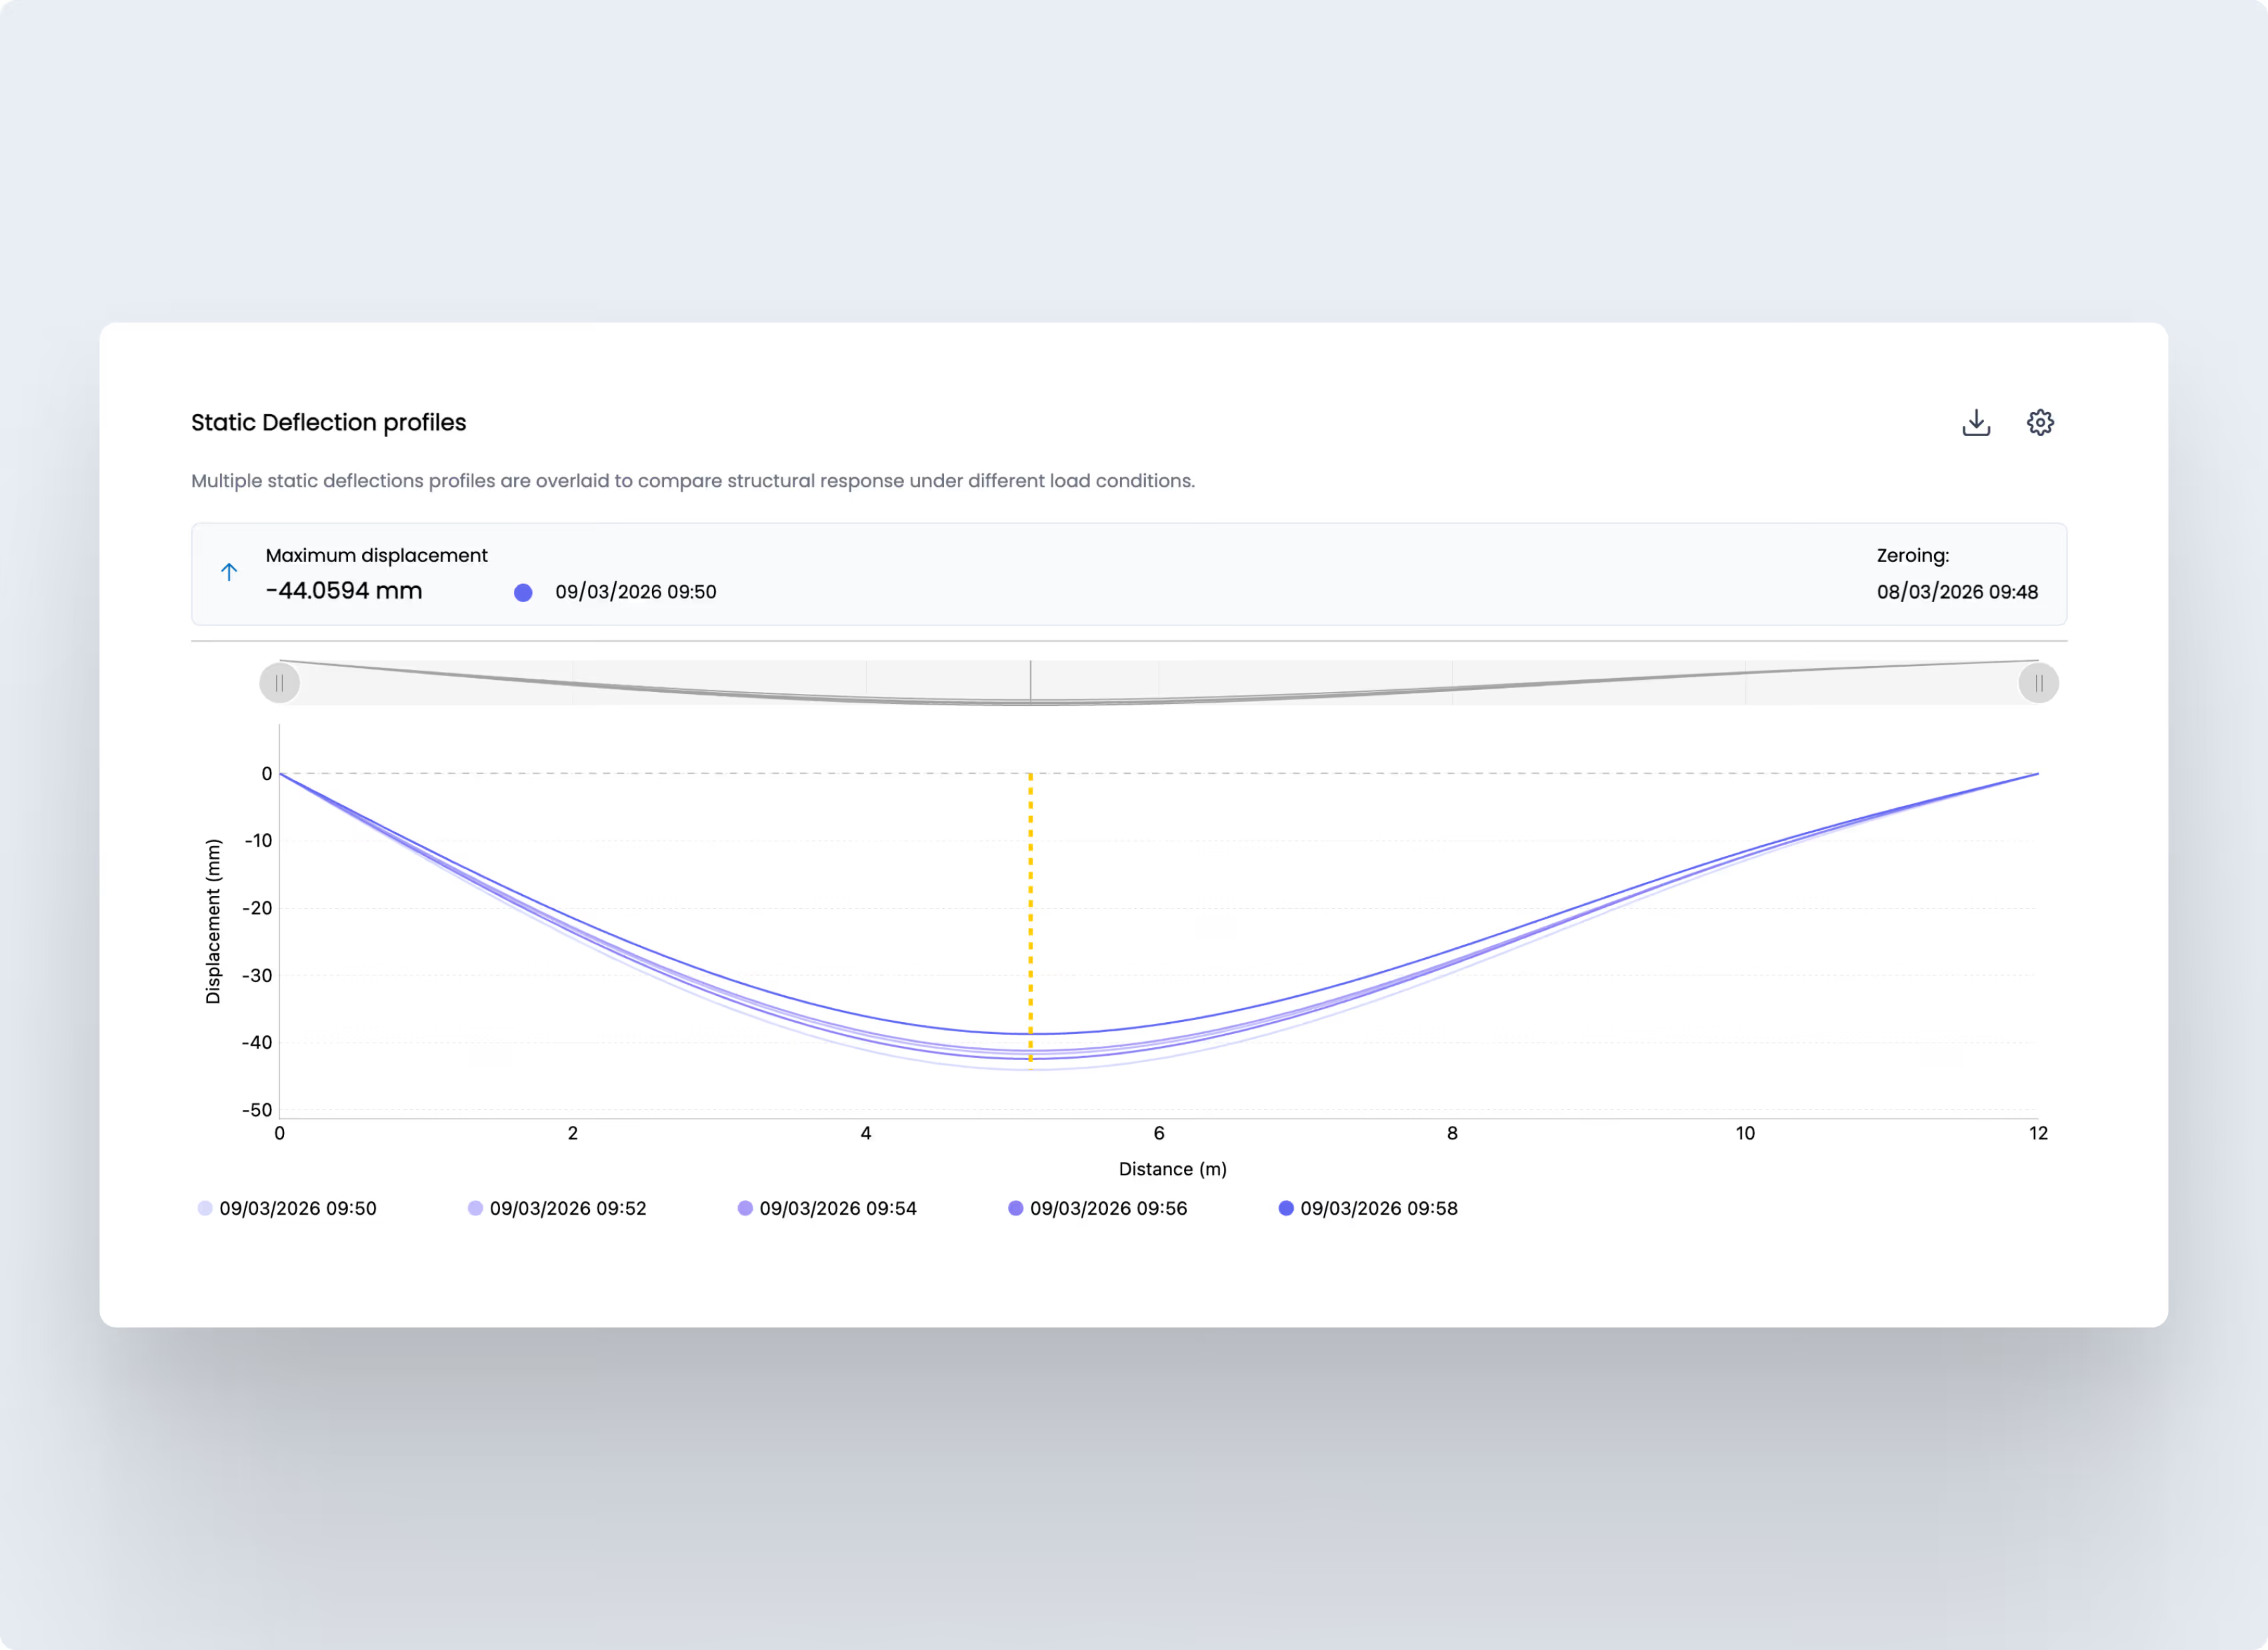
Static deflection profiles
Multiple curves from the same sensor group overlaid for direct, visual comparison across timestamps and load tests

Maximum displacement
The highest vertical displacement in the profile, expressed in millimeters, at the point of maximum deflection

Maximum displacement trend
A line chart showing how the peak displacement evolves over time within the selected load test
Automatic static deflection profiles
For each synchronized measurement timestamp, the tool converts tiltmeter data into a static deflection profile (y = f(x)) along the span, reconstructing the vertical displacement curve between the fixed endpoints. Profiles are computed relative to a baseline (zeroing timestamp), so each curve represents displacement compared to the selected reference condition.
The tool automatically stores and overlays multiple profiles from the same sensor group, enabling direct comparison across loading phases and test campaigns. Use overlays to assess repeatability, identify asymmetries, and detect potential changes in stiffness or boundary conditions through variations in curvature, peak location, and overall shape.

Trend of maximum displacement
In addition to full profiles, the tool extracts maximum displacement (Ymax) from each curve and plots a maximum displacement trend over the selected load test.
This output provides a compact view of peak deflection over time, useful to validate load-step consistency, compare different testing days, and highlight residual deflection after unloading. You can track how peak displacement evolves across hours, days, weeks, or separate campaigns, while keeping the underlying profiles available for detailed shape inspection.
How load tests work (zeroing and test separation)
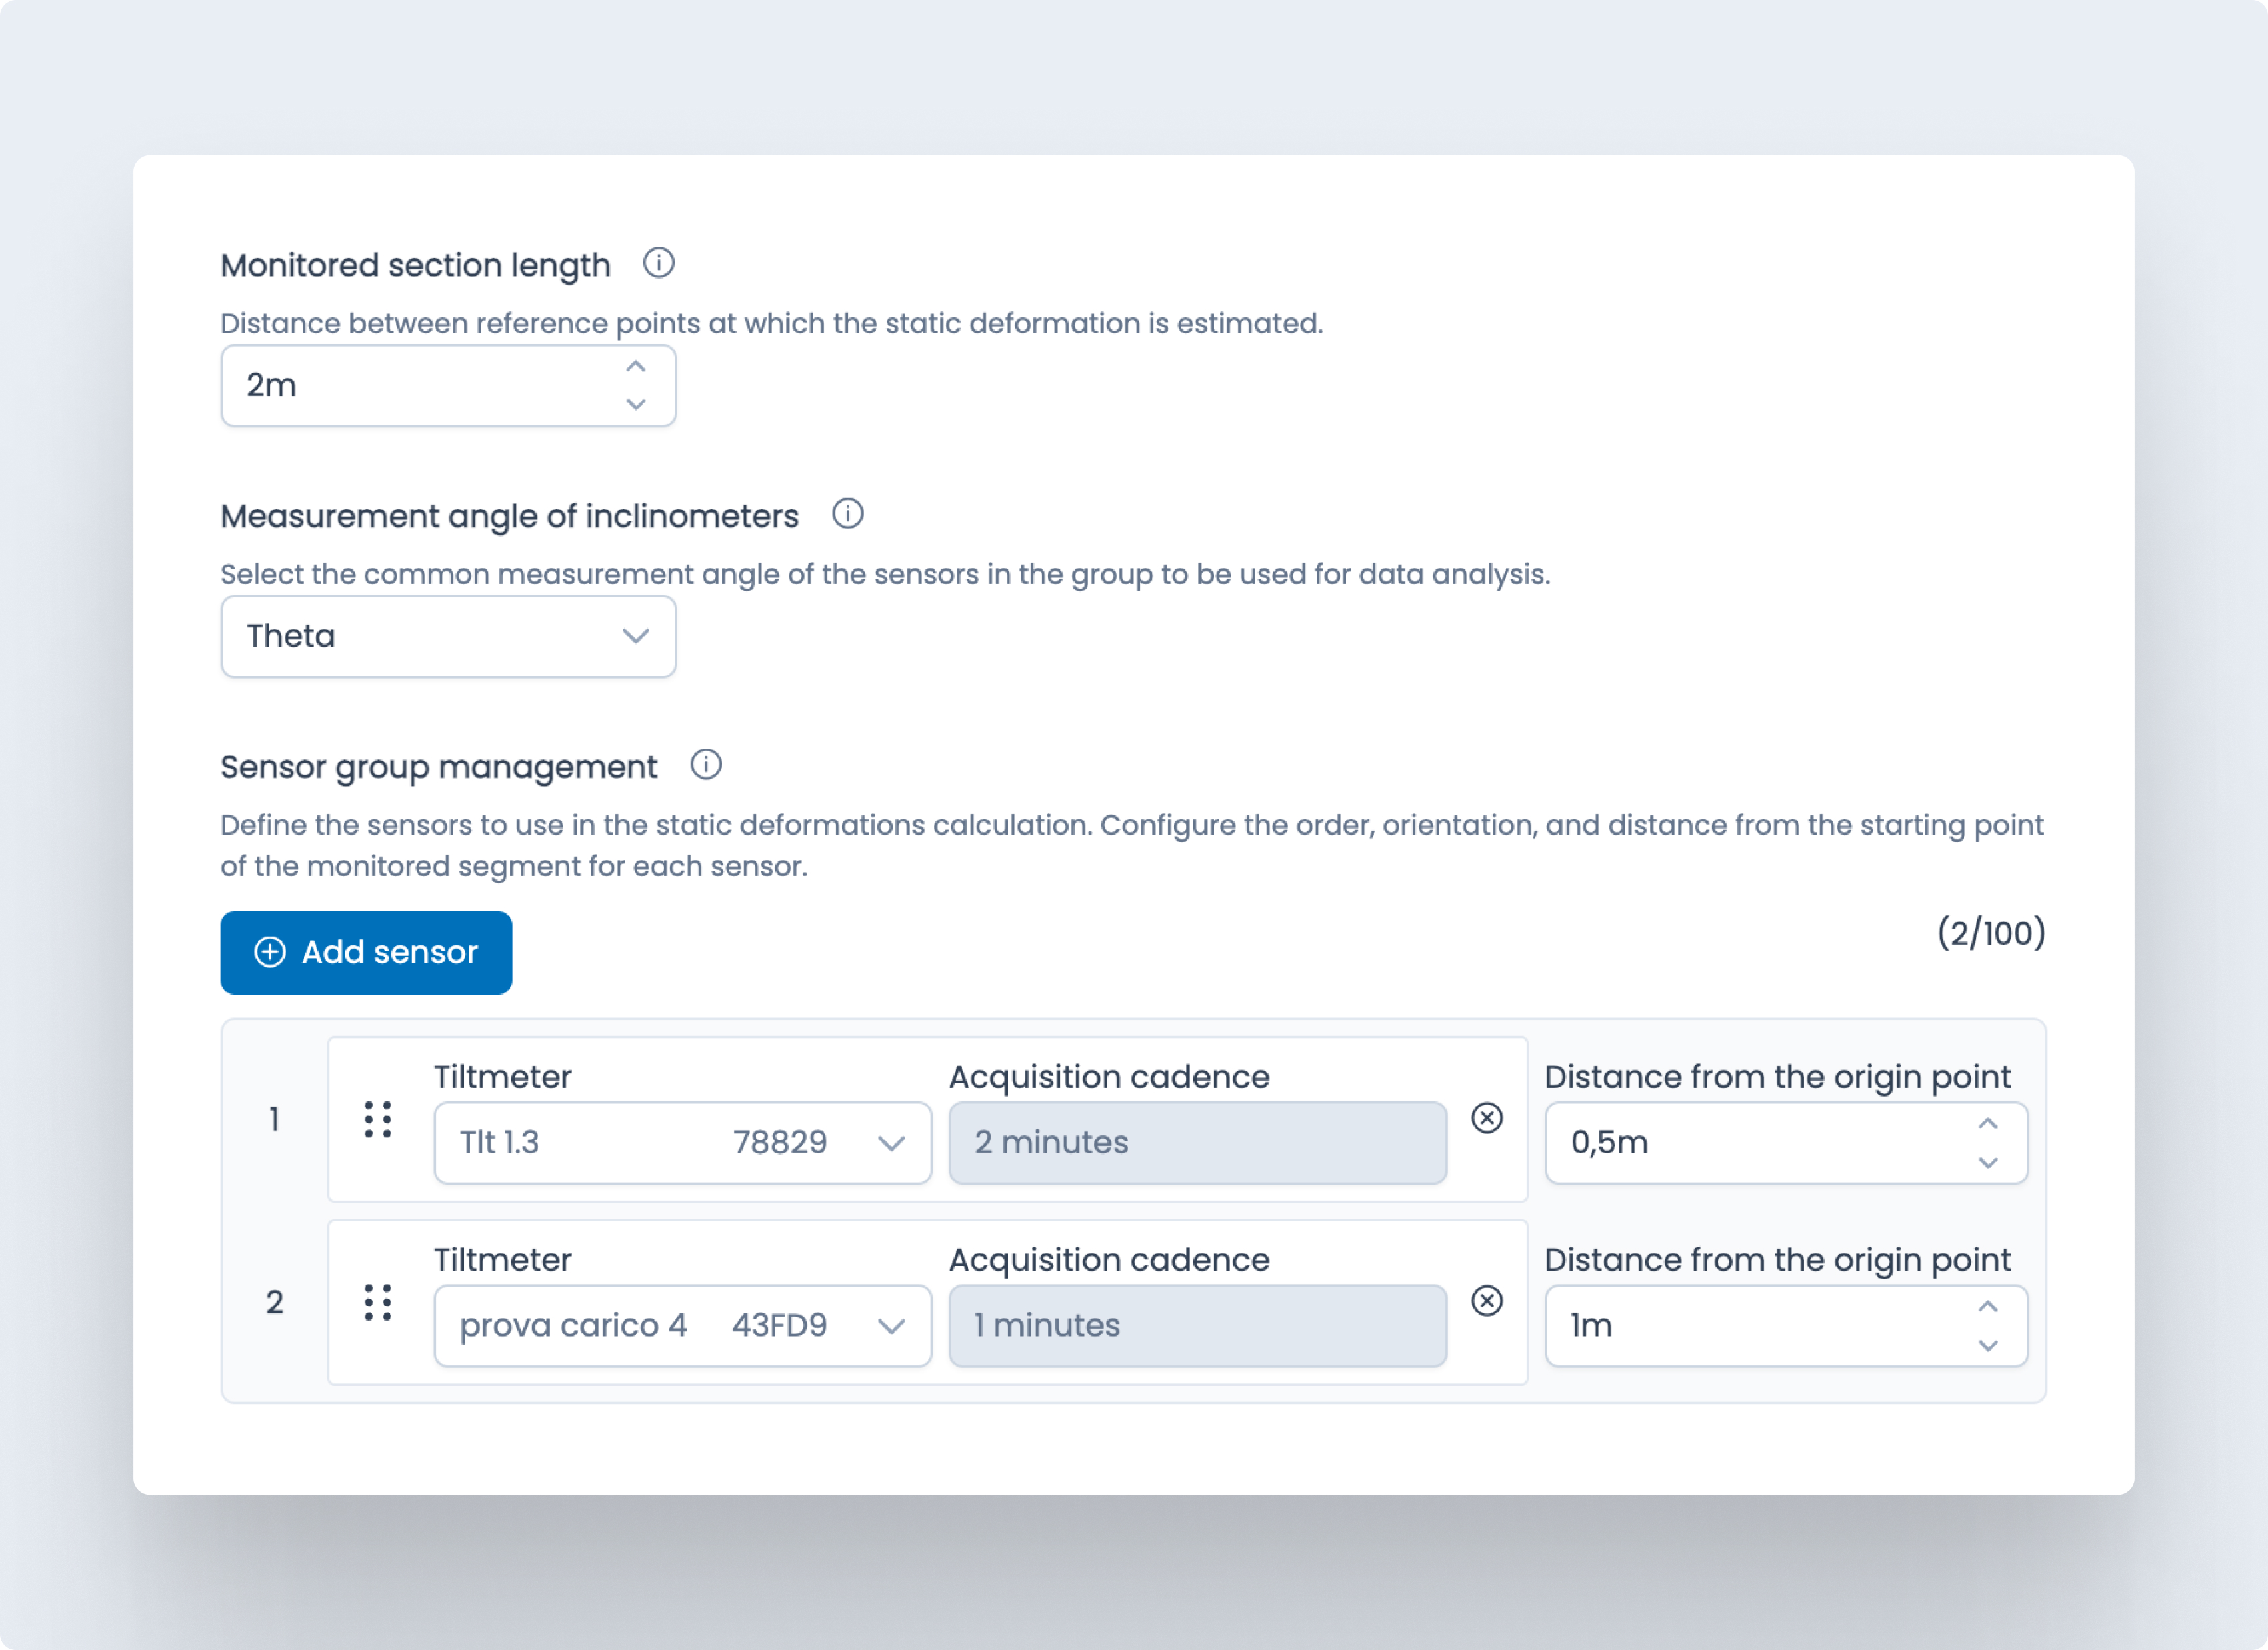
Create a tiltmeter sensor group once by defining span length, sensor order, and sensor positions along the structure. Then start a new static load test by selecting a zeroing timestamp that represents the baseline (typically an unloaded condition) and assigning a test name.
Each zeroing defines a dedicated load-test context: profiles and peak values are calculated against that baseline, keeping results organized and comparable even when tests are months apart or when sensors are temporarily redeployed on another span.
Application areas
Bridges and viaducts
Validate span behavior under static load, compare campaigns, and detect changes in stiffness or residual deflection over time.
Railway bridges
Run proof load tests and track maximum displacement under controlled loads to identify stiffness variations.
Footbridges and pedestrian structures
Check deflection limits for comfort and serviceability criteria, then compare tests before and after adjustments.
Decks and slabs
Assess deflection under static loads to verify serviceability and support on-site acceptance checks.
Heritage and masonry arches
Monitor deflection patterns during controlled load tests to identify vulnerability and long-term residual effects.
Industrial structures and bays
Test beams and bays under known loads to validate performance and document results for compliance.
Temporary installations and shoring
Verify deflection under staged loads to ensure stability during construction phases and temporary works.
Custom applications
Apply the same workflow to special spans or setups where repeatable, comparable static profiles are required.
Fully integrated into MyMove
The Static Deflection Tool eliminates the need for manual post-processing, spreadsheets, or external scripts.
Every calculation is embedded into the MyMove platform, allowing engineers to directly reconstruct the deflection curve and access field-ready structural insights in real time.