Keep track geometry under control over time
Compute cant and twist from wireless tiltmeters on the sleepers, track changes over time on a full map view, and set section-level alarms
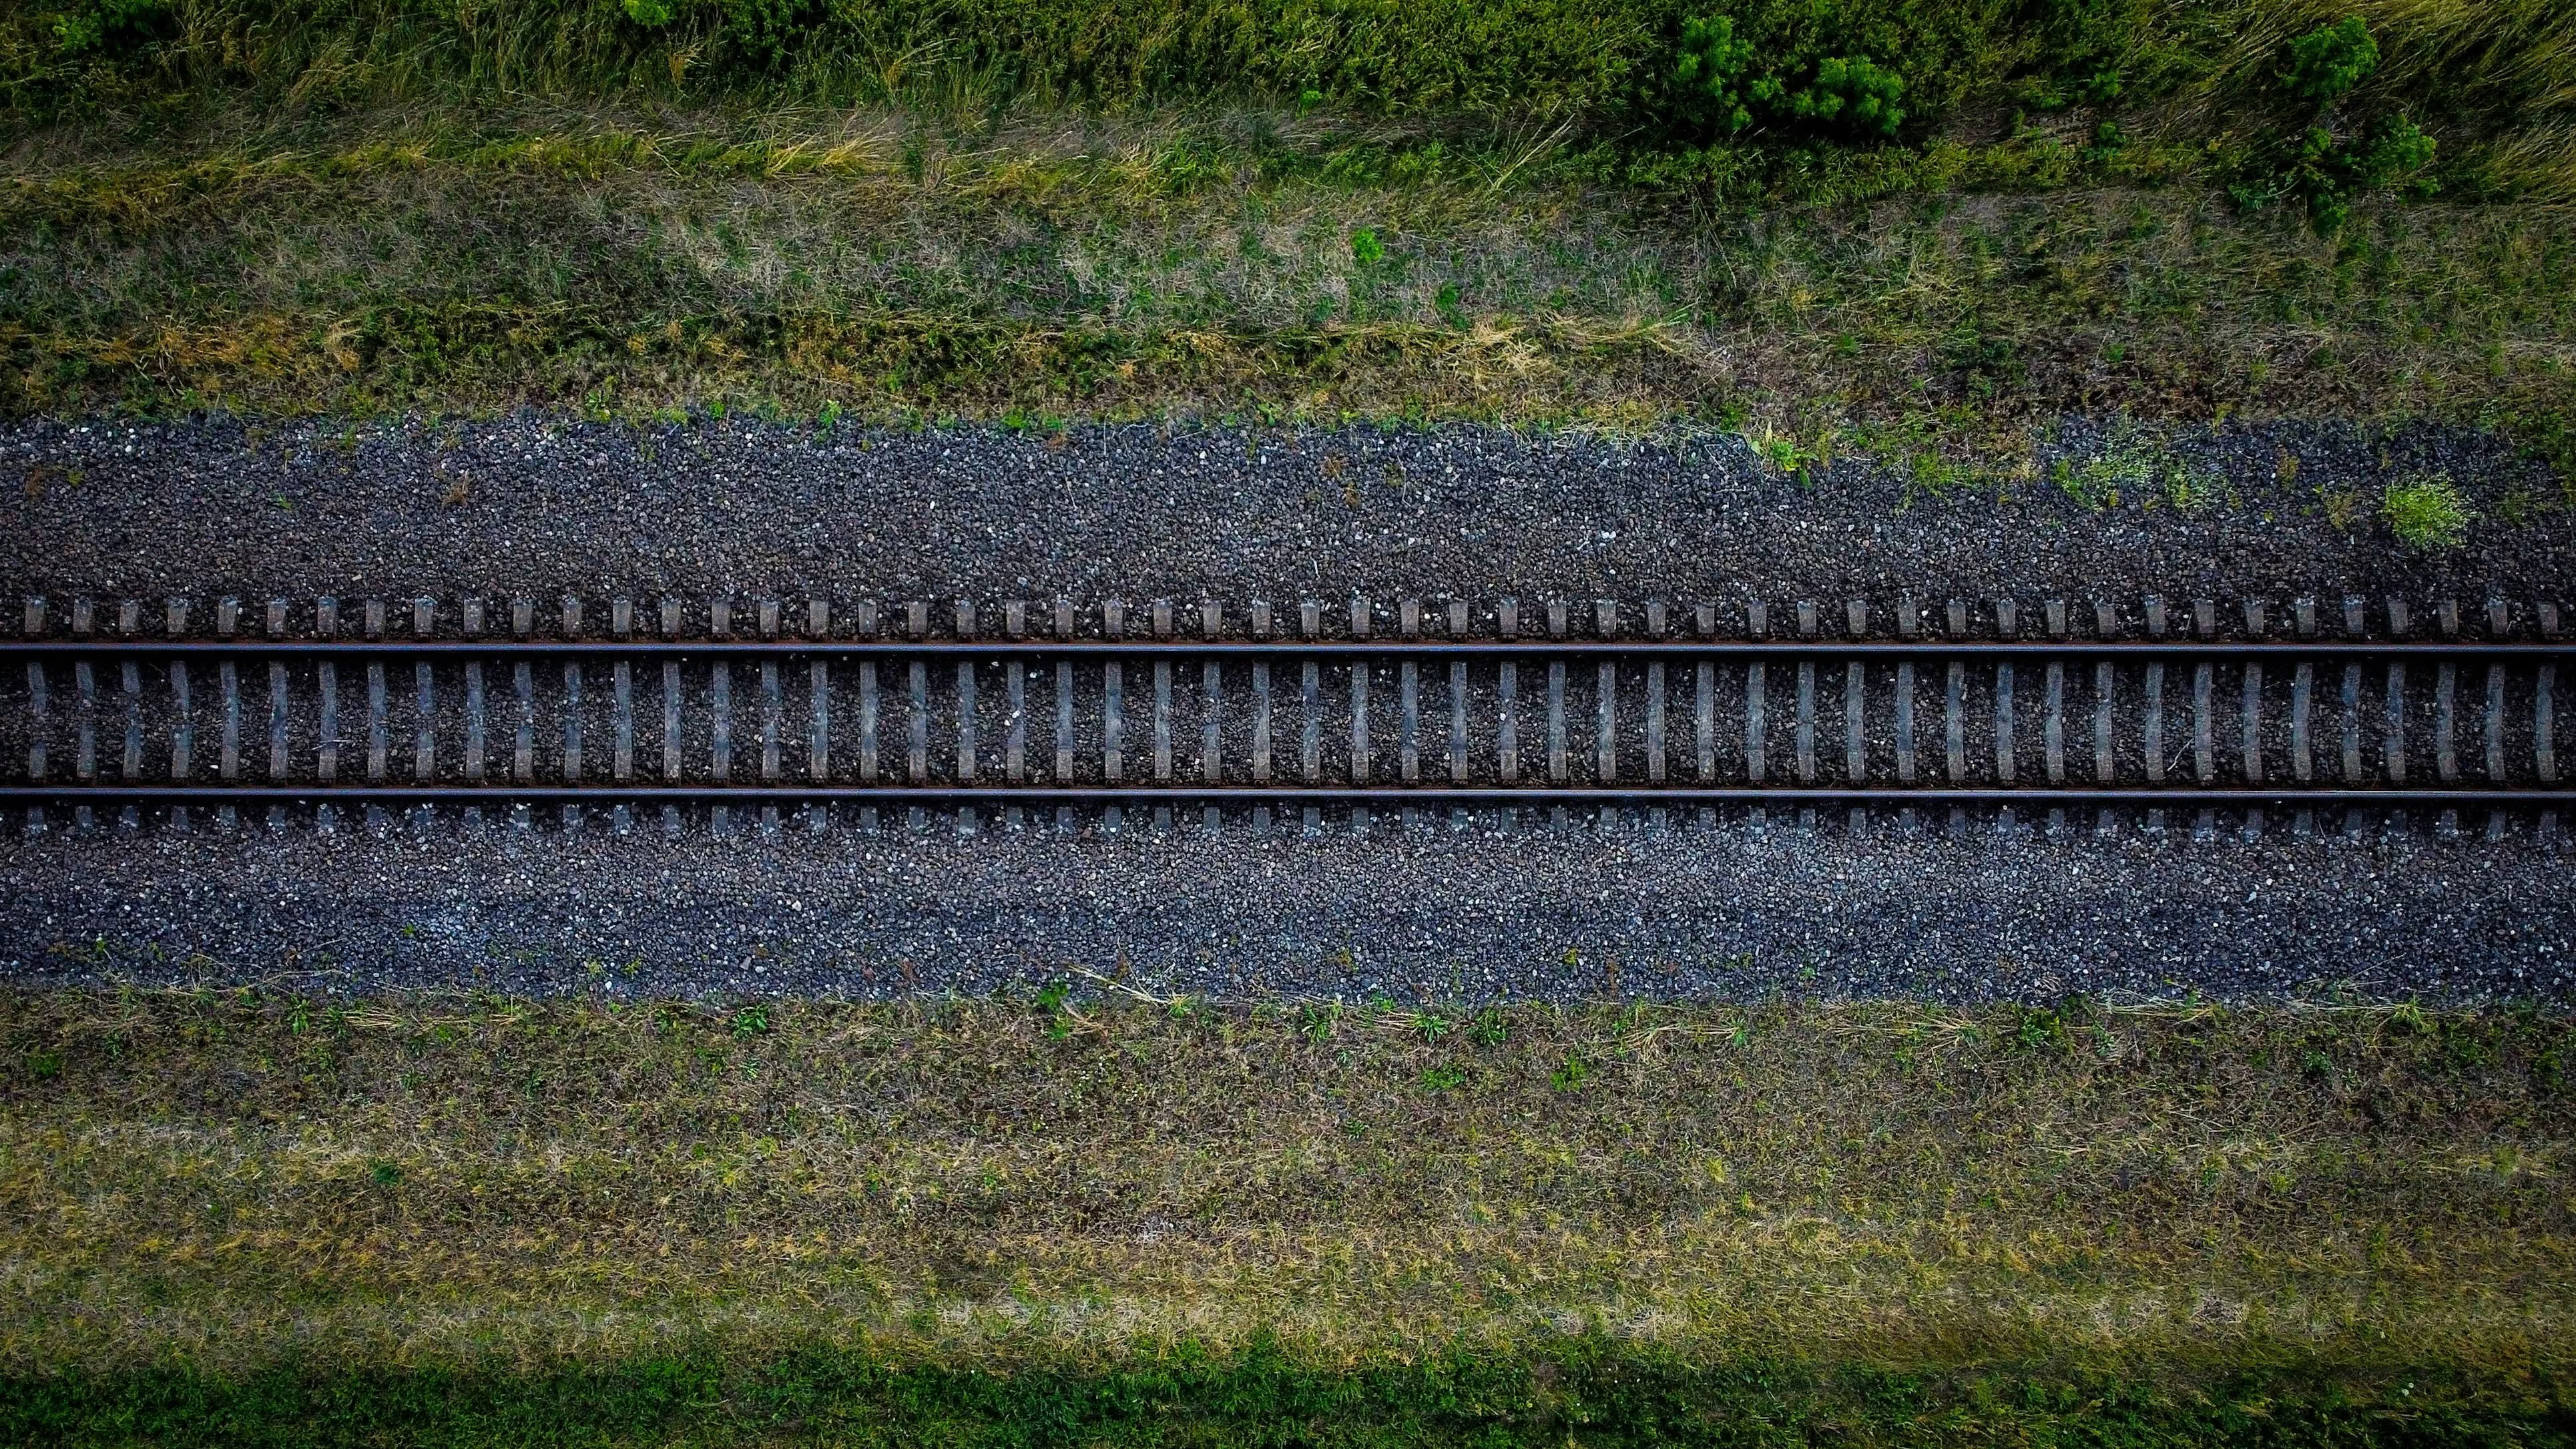
Monitor the integrity of tracks
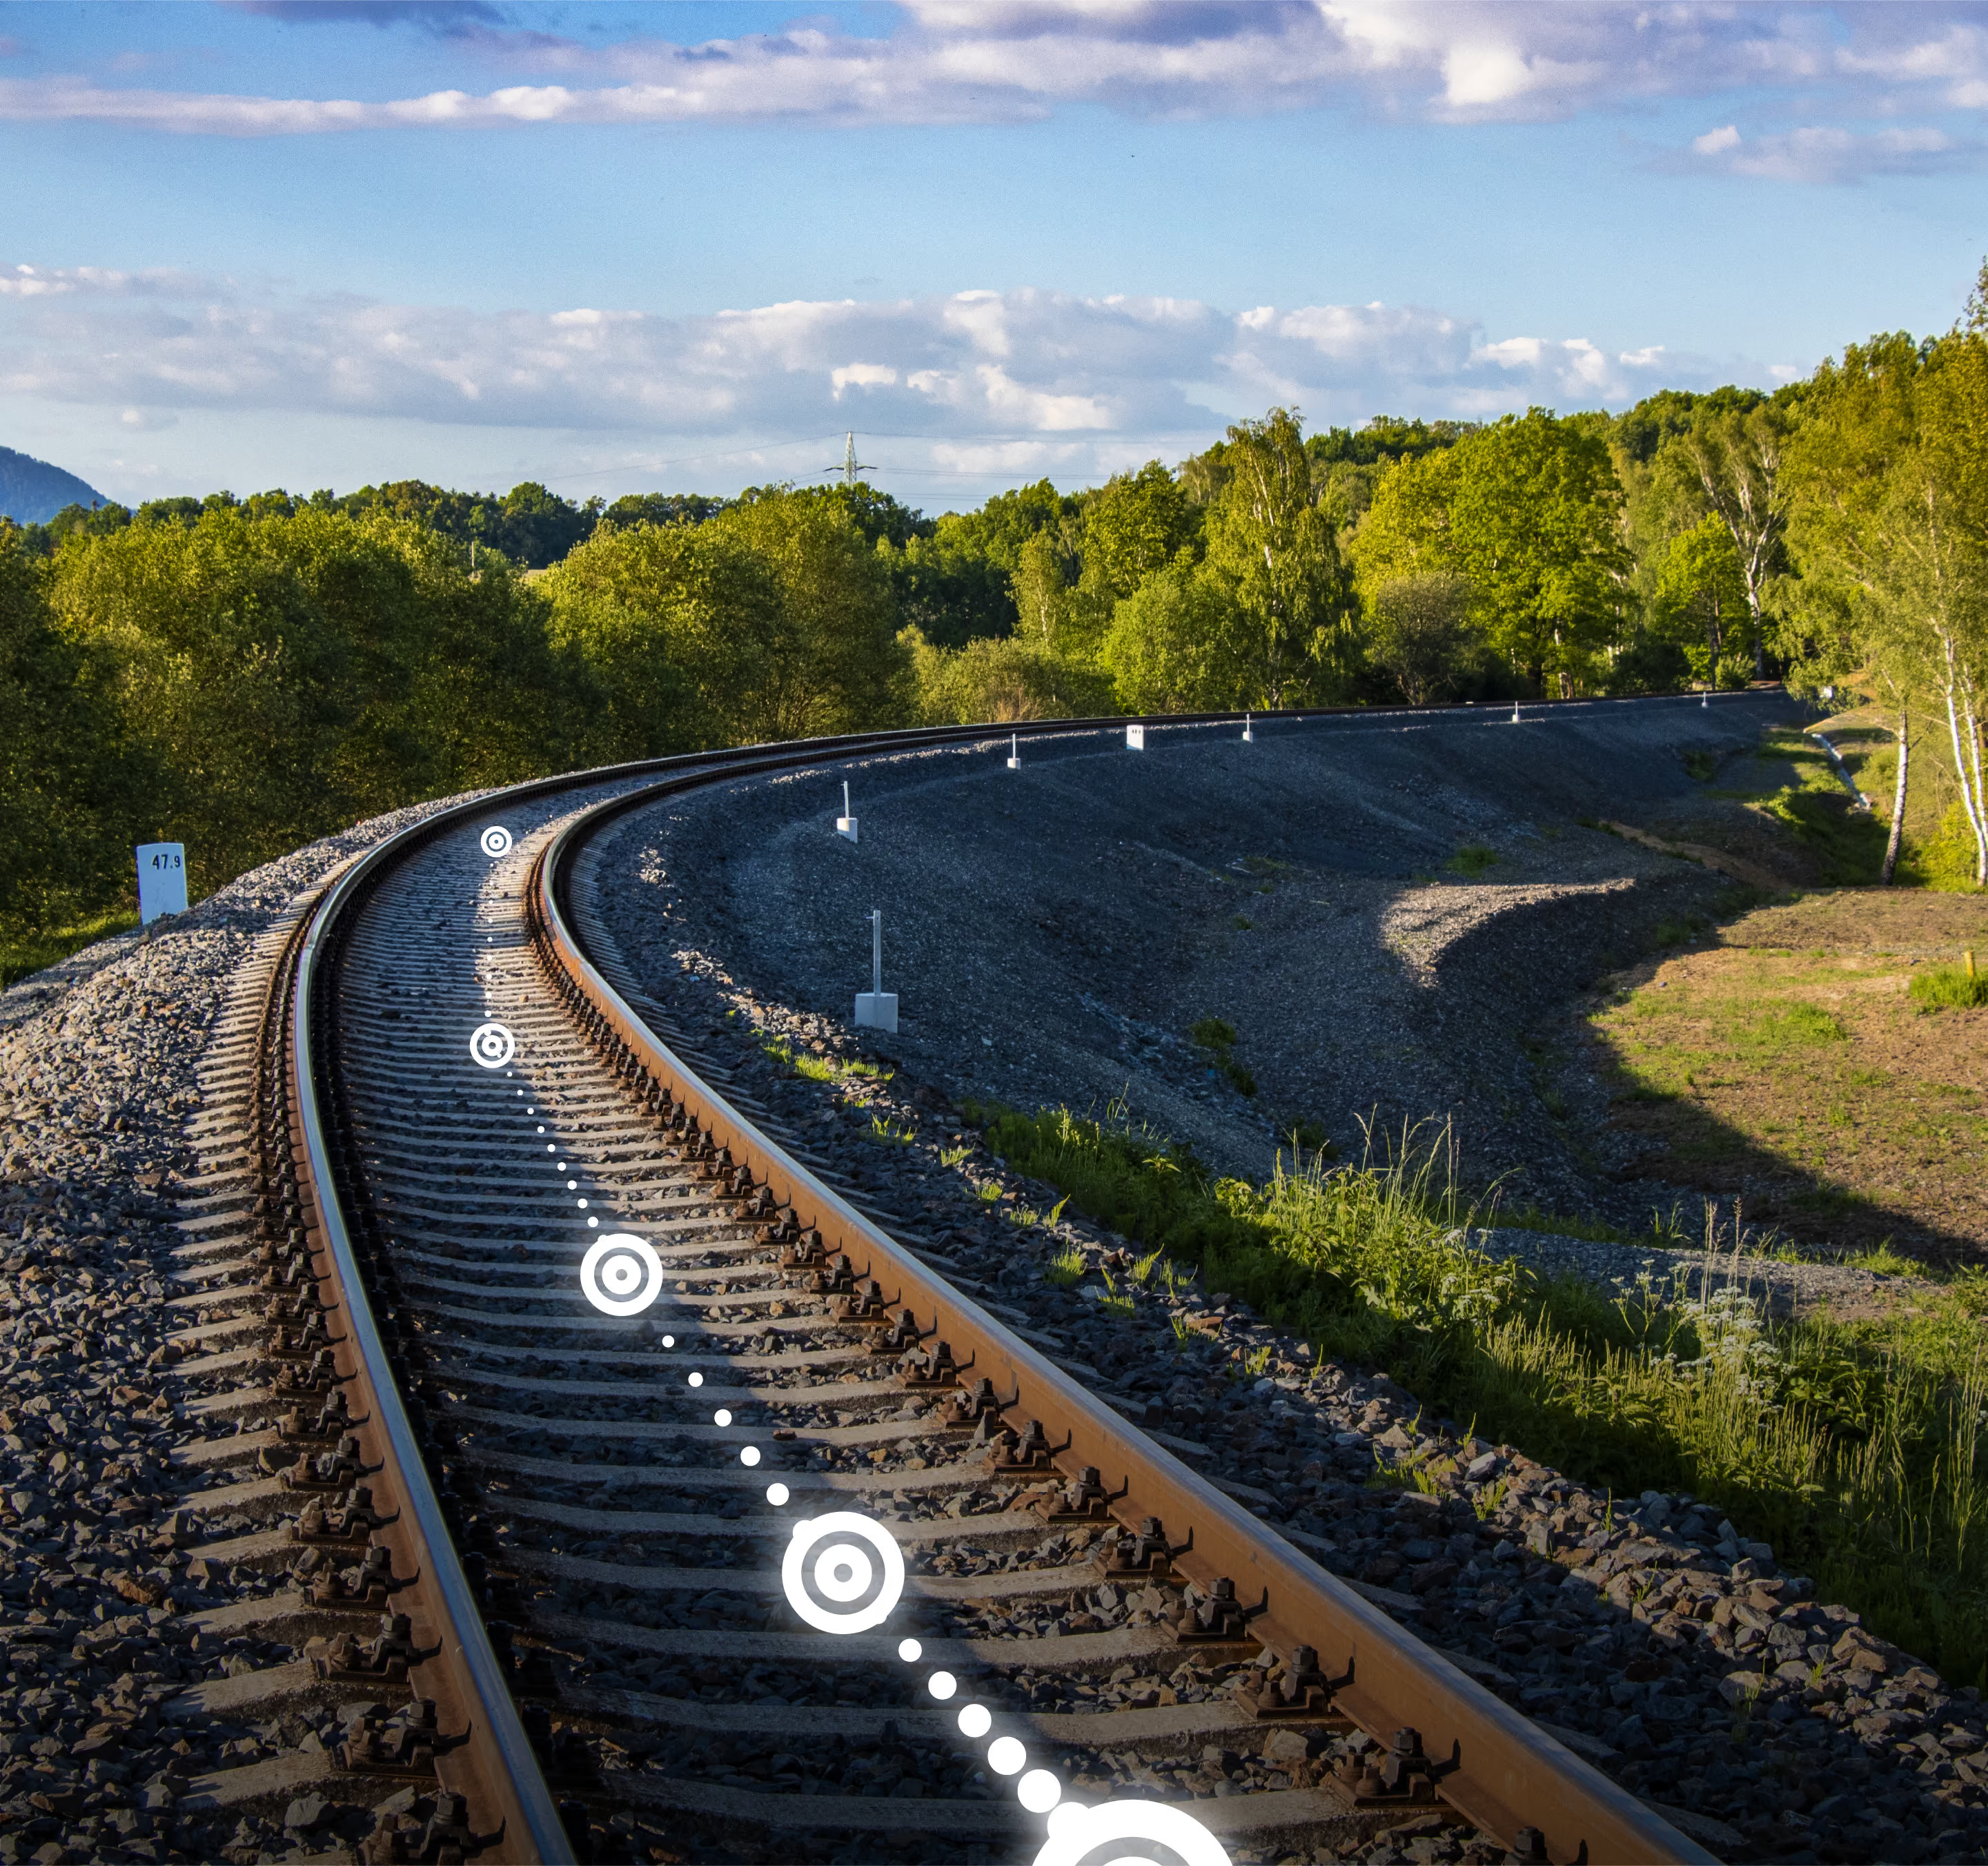
Monitor the cant and twist of rail tracks using readings from wireless tiltmeters on track sleepers. Follow how the section behaves over months on a full-screen map view
Structural analysis outputs

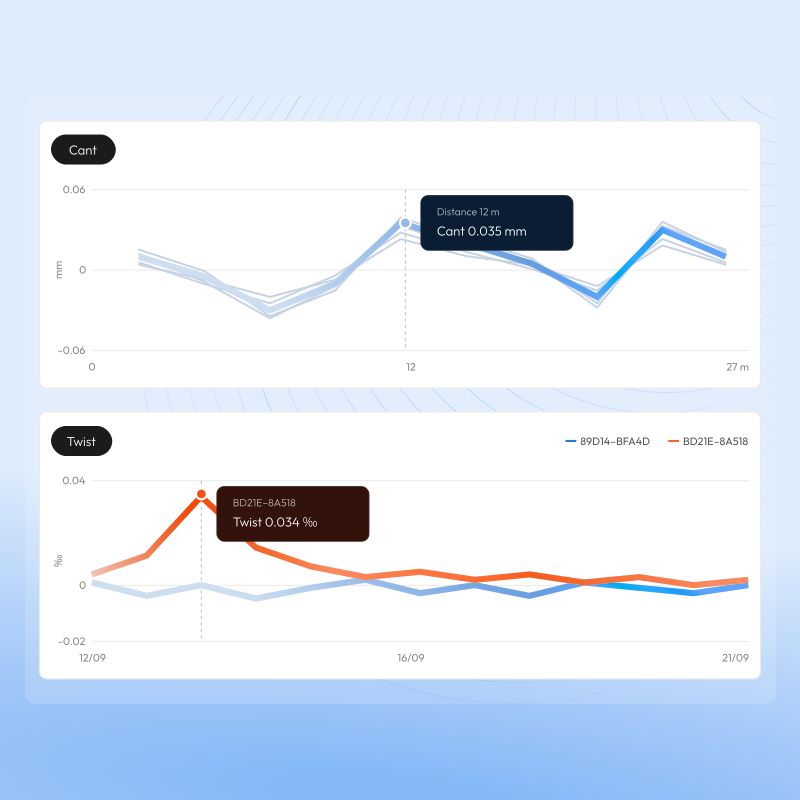
Cant along the section
The cross-level between the rails. One value per monitored sleeper in mm, plotted in order along the track.

Twist along the section
The change in cant between consecutive monitored sleepers. Where the deformation concentrates, and how sharply

Twist over time
Each pair's twist followed acquisition after acquisition, one trace per pair. Whether a deformation is progressing, and how fast

Cant over time
Each sleeper's cant followed acquisition after acquisition, one trace per sleeper. Whether a change is still moving or has stopped
Cant and twist from tiltmeters on the sleepers
One wireless tiltmeter per monitored sleeper is enough to derive cant using the track gauge and twist from the cant difference between consecutive sleepers. Sample the tilt of whole sections synchronously and analyze it along with temperature.

Absolute and differential values
Analyze absolute values, or set a zeroing timestamp and read every differential value against that baseline. Zeroing applies to the whole section at once. MyMove picks the nearest complete acquisition, so the baseline is one where every sleeper reported, and removes the installation offset: what you see is the change since then.
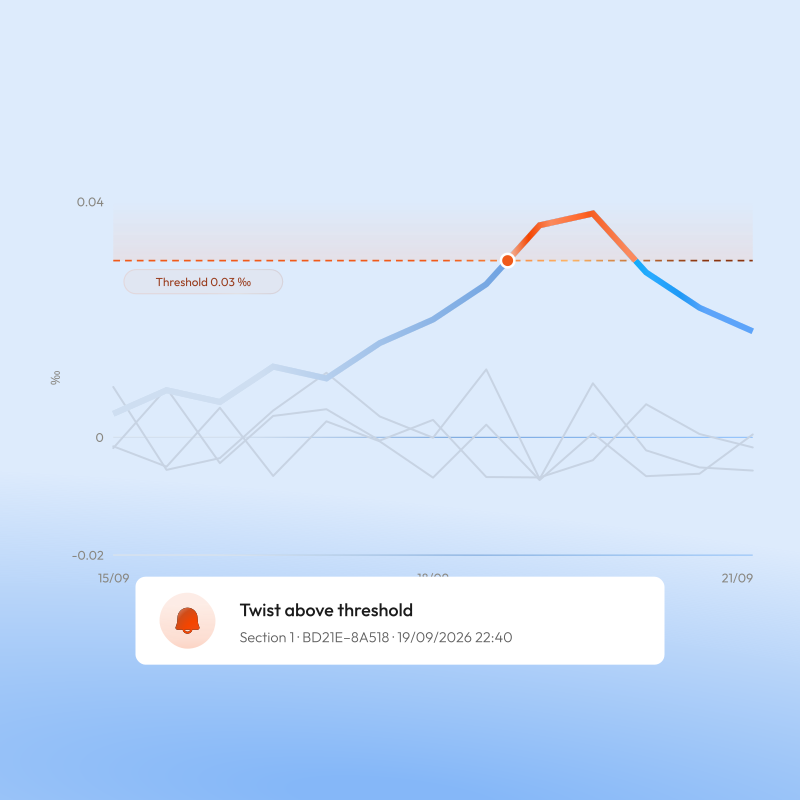
Alarms on cant and twist, section by section
Three severity levels per parameter, alert, warning and critical, each with a minimum, a maximum or both. Every acquisition is checked against them as it arrives, so an alarm reports the state of the section at that moment, not a trend. Notifications can fire on every crossing or only when the severity changes. Each alarm carries the section, the device, the timestamp and the value that triggered it.
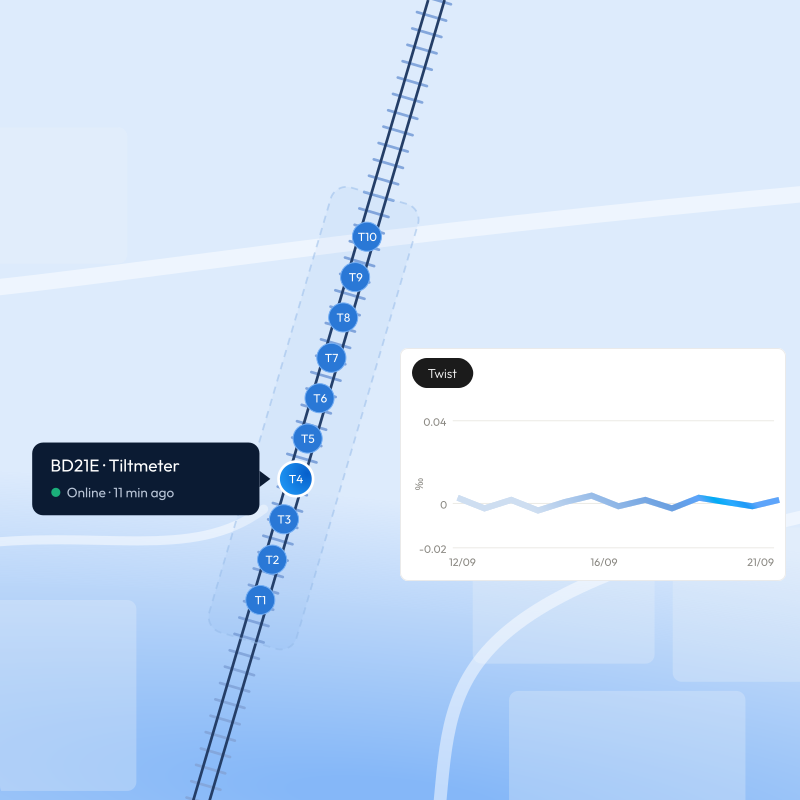
Read the whole line on the map
The Railway Tool ships with the new Map View: a full-screen, geographic representation of the installation, with drag-and-drop panels and both map and tabular views.
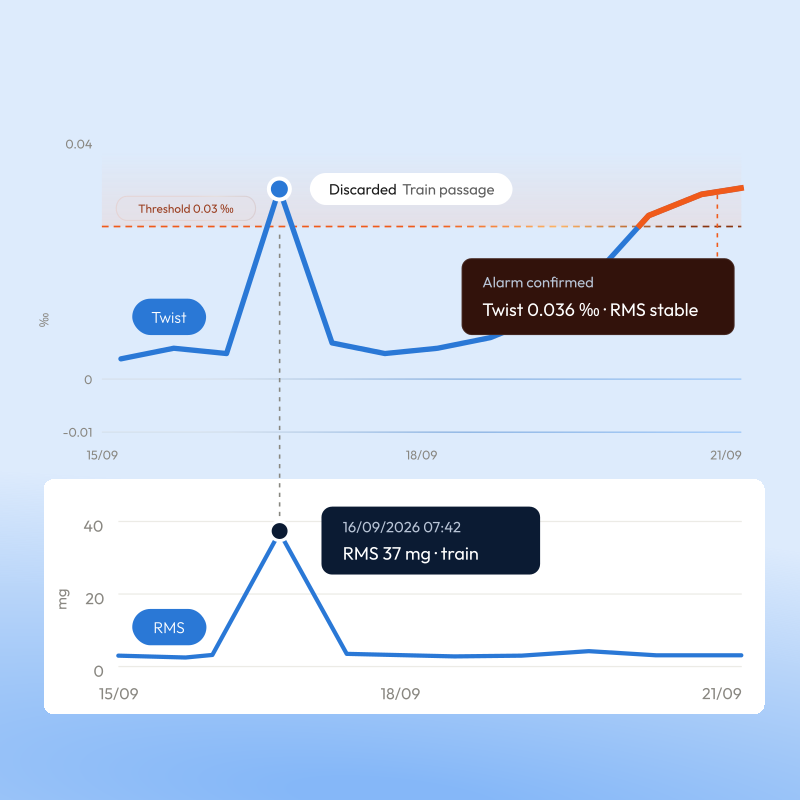
Discard false alarms caused by train traffic
Watch RMS values to see if an alarm is caused by changes in cant and twist or simply by a passing train.
Application areas
Railway bridges
Track cant and twist on the structure to catch stiffness changes and residual deformation under repeated dynamic loads.
Transition zones
Monitor the stiffness discontinuity between bridge and embankment, where differential settlement and twist tend to concentrate
High-speed lines
Keep geometry within tight tolerances on stretches where even small twist variations affect safety and ride quality
Track on settlement-prone ground
Follow slow cant and twist changes over embankments and soft soils to plan intervention before a defect forms
Sites near construction or excavation
Detect early geometry shifts caused by nearby works or ground movement, with remote, continuous readings
Long-term and geotechnical-risk monitoring
Support maintenance planning and risk assessment with a documented, comparable history
Custom applications
Apply the same workflow to special layouts where repeatable, comparable geometry readings are required
Fully integrated into MyMove
The Railway Tool removes manual post-processing, spreadsheets and external scripts. Cant, twist and their trends are computed inside the MyMove platform from the sensors already on site, read on the map view, and watched by section-level alarms. It gives engineers field-ready track geometry insights in real time, from anywhere.