One workspace for your asset data
MyMove unifies data sources and turns them into clear answers with reports. Use advanced analytics and dedicated engineering tools or ask Move Intelligence to analyze for you.





















Analyze asset data on MyMove

Process asset data faster
Stop exporting spreadsheets and building charts by hand. See what's happening across all your structures, live.
Cut costs with early warnings
Fewer site visits, fewer surprises. Get alerts when thresholds are exceeded, using custom limits or standards-based templates.

Keep data in one place
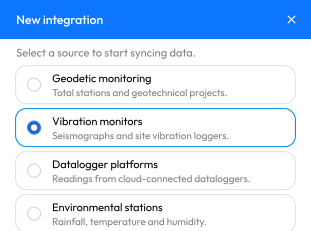
Bring every data stream into MyMove, from Move sensors to third-party devices and external datasets. One platform, one source of truth.

Get clear answers with AI
Ask questions in plain language, get charts instantly, and surface trends you'd otherwise miss.

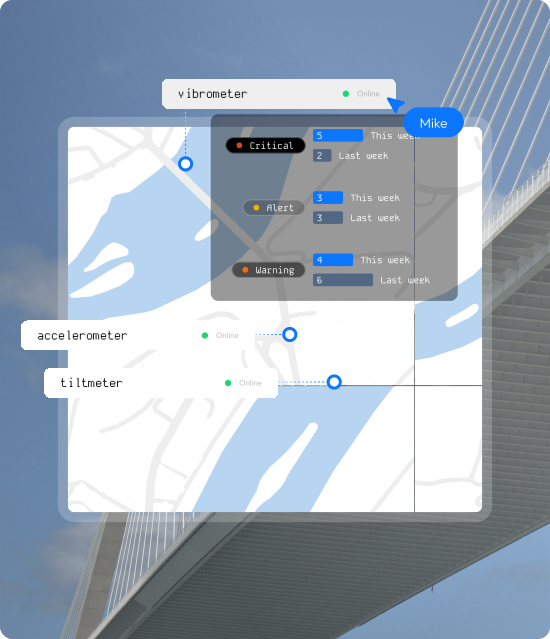

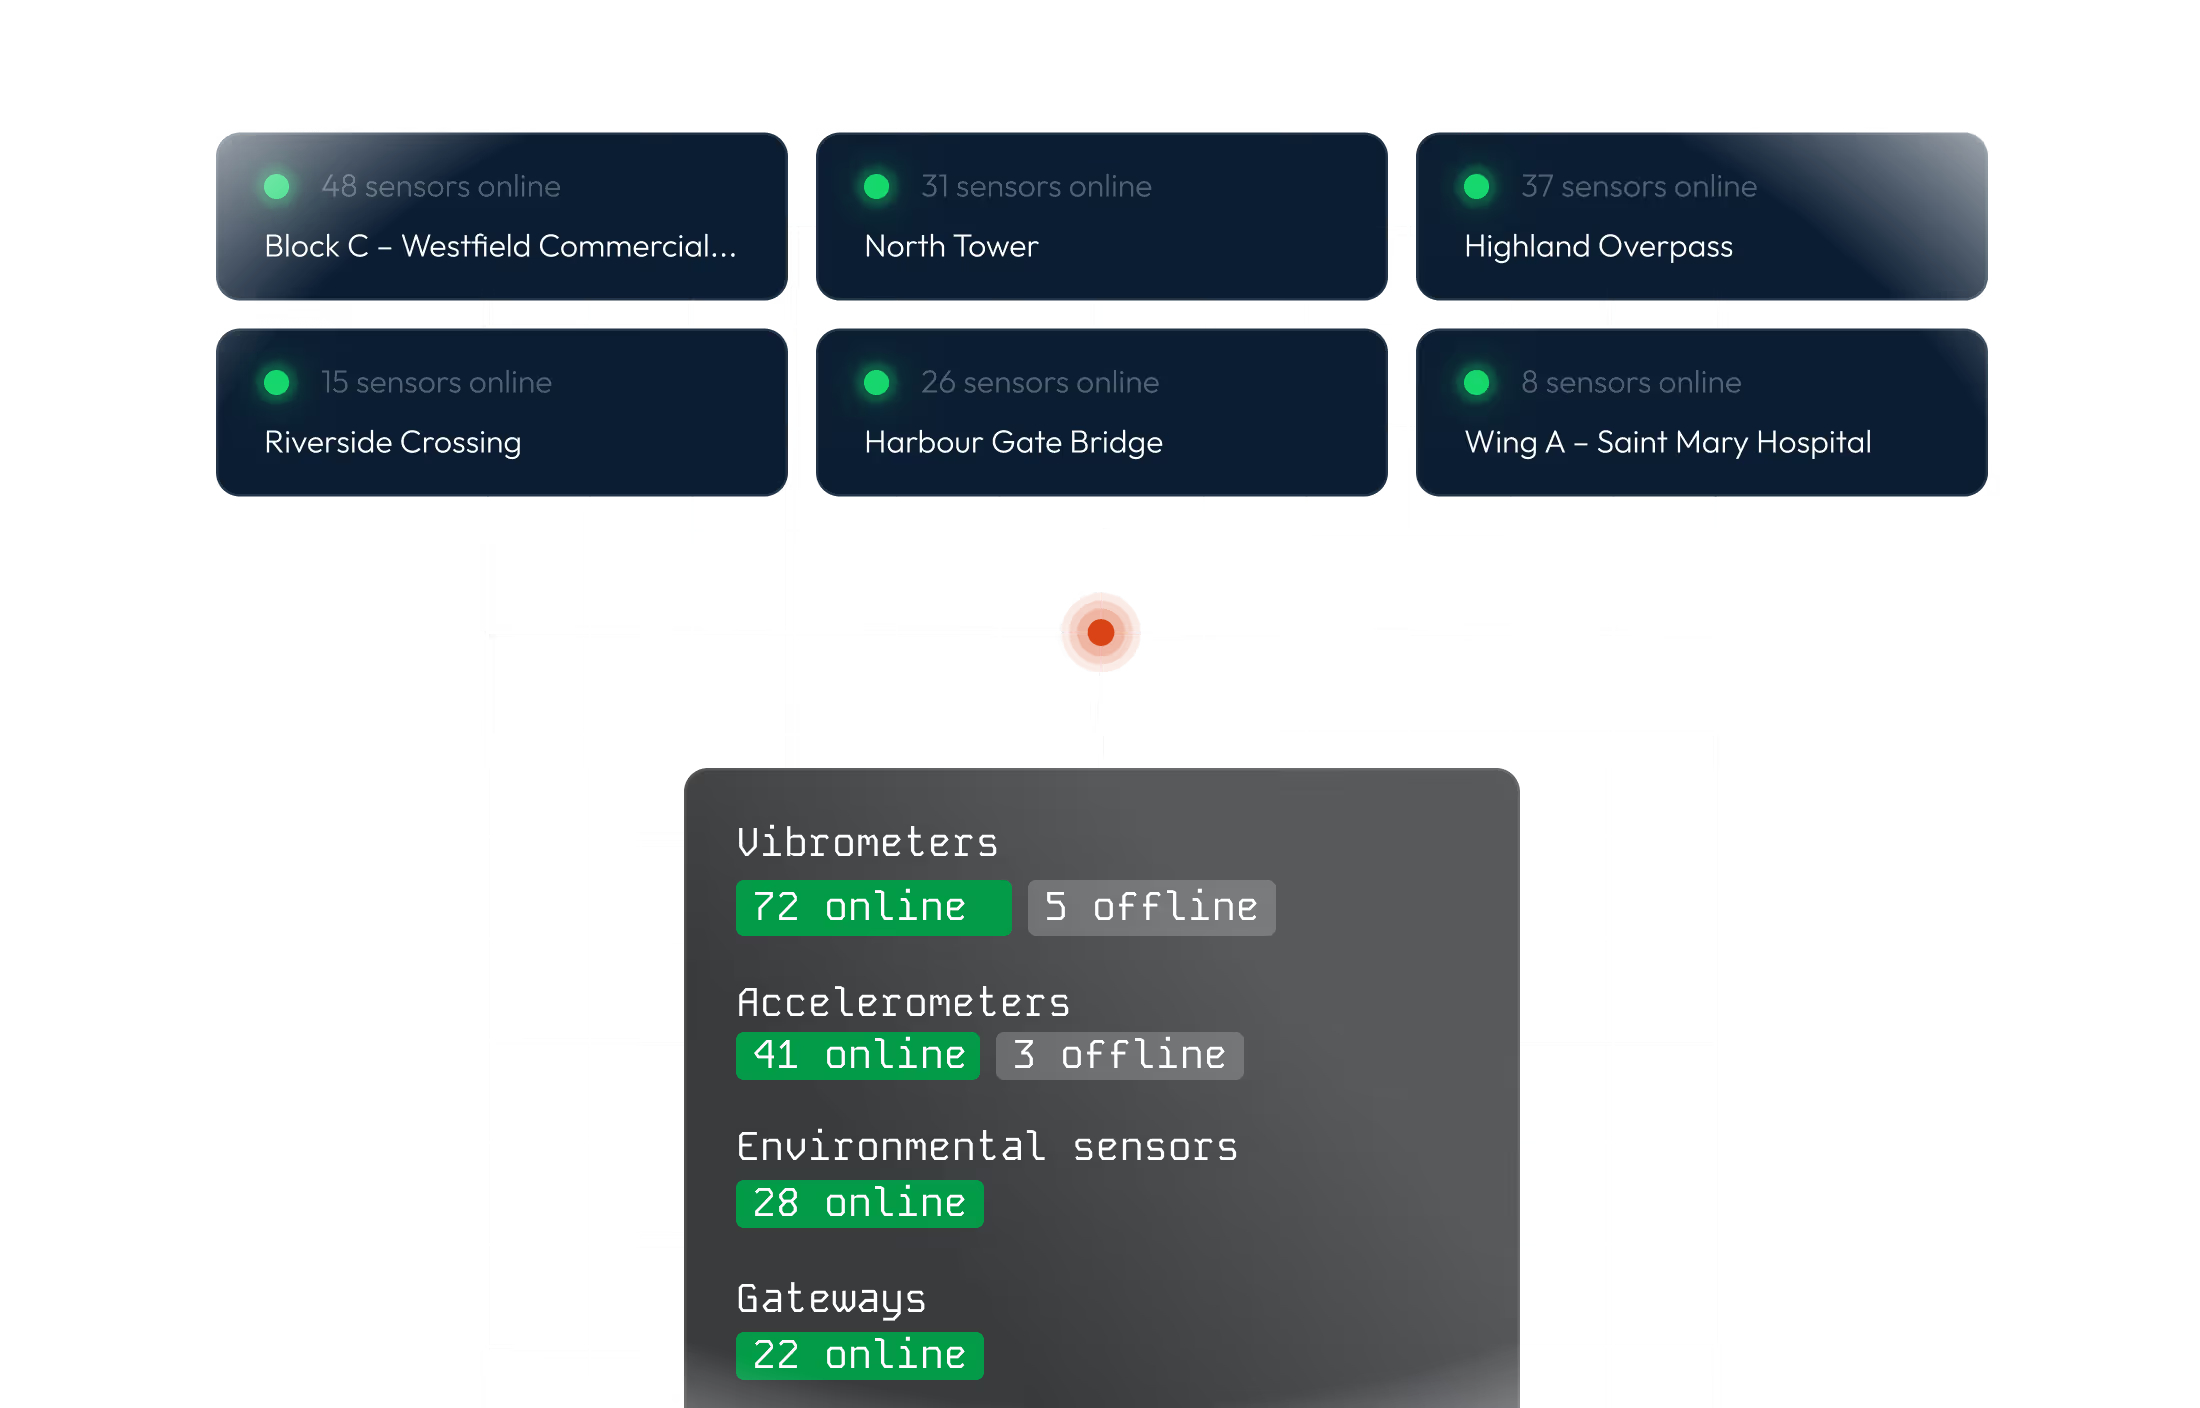
Know your network is up, without going on site
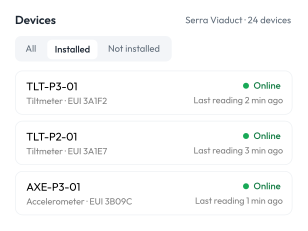
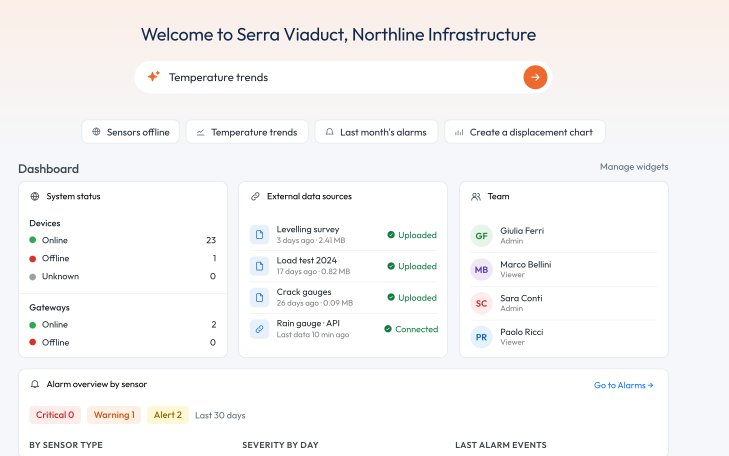
- Live status: last reading, connection status and signal quality for every device, on one screen.
- Multi-view device management: Manage all your sensors in one view on maps, photos, or as a list
- Connection health: see at a glance if a device stops transmitting or a data source stops feeding, before the gap shows up in your analysis.
- Any input, one status: sensors streaming directly, third-party devices, and uploaded files, each with its own connection state.
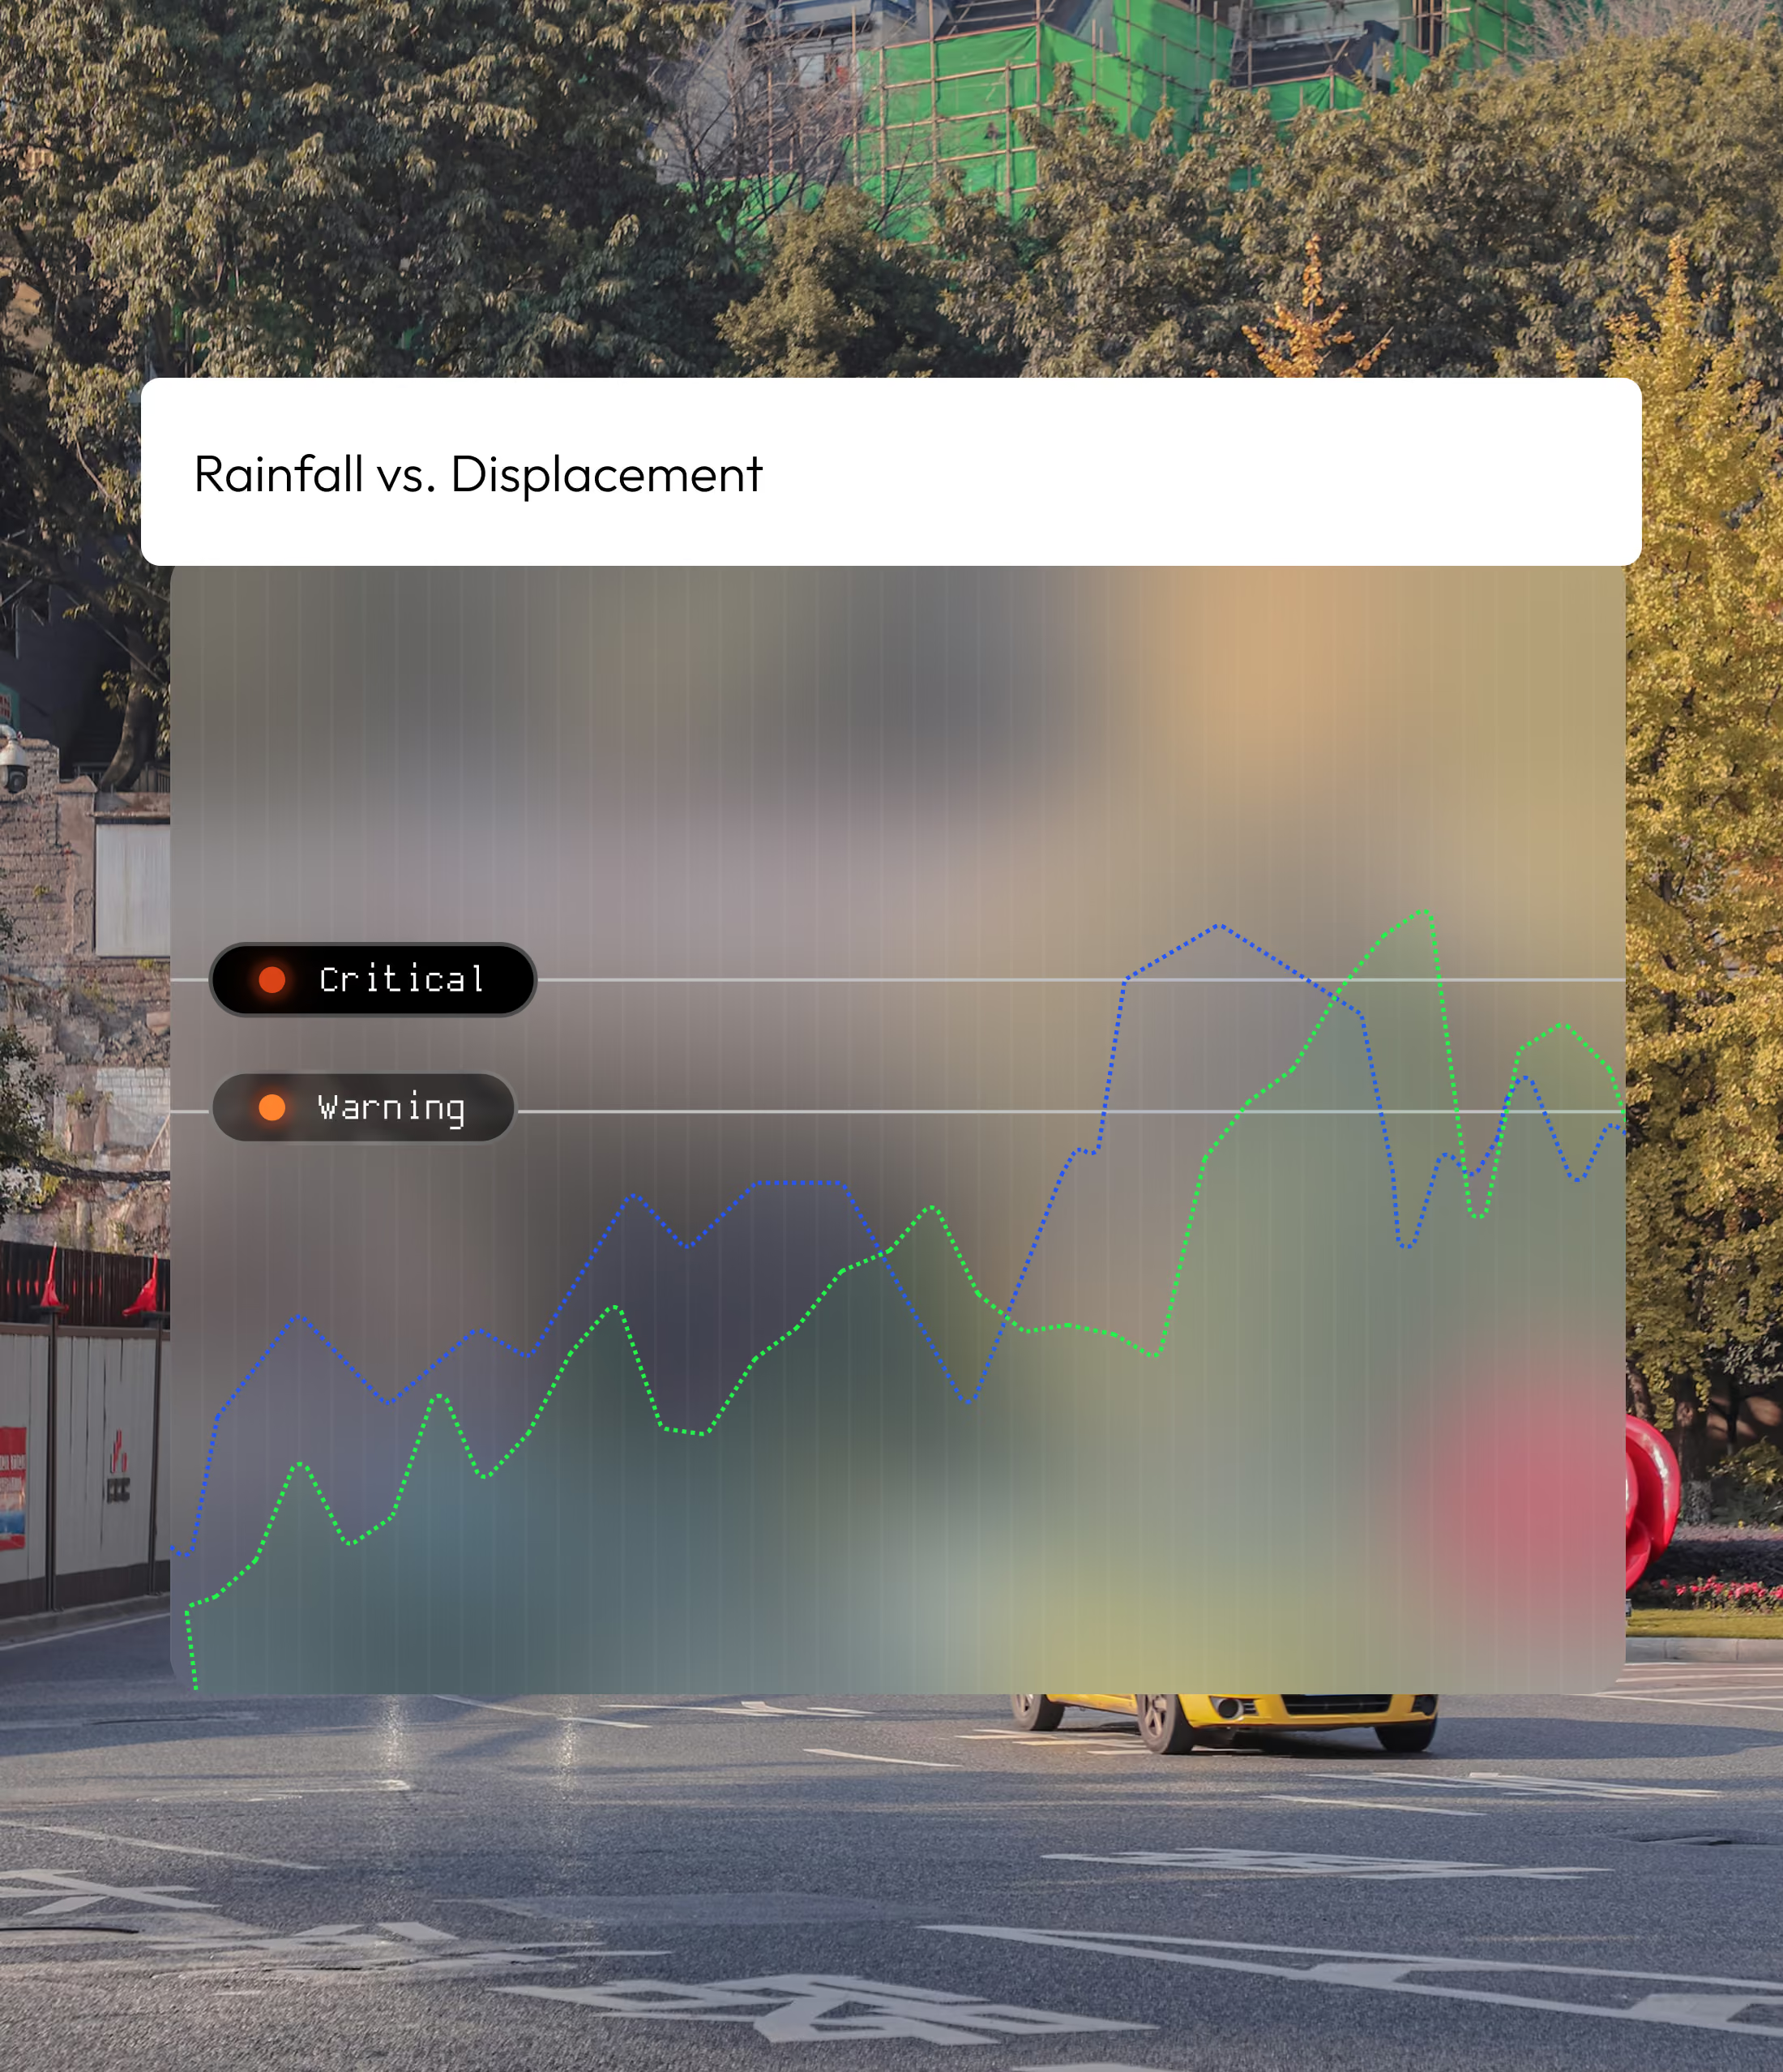

Go deeper with multi-device comparisons and correlations
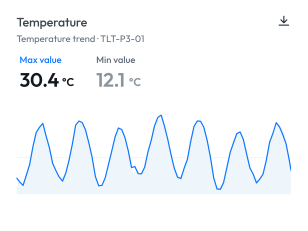
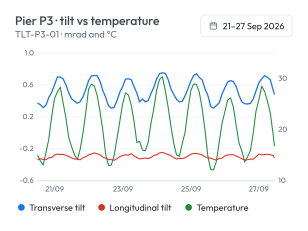
- Custom charts: overlay parameters, compare time windows, correlate data from multiple sources
- Pattern discovery: Identify patterns that would take hours to find manually
- Advanced tools: Use advanced tools for modal shape analysis, tilt chains, and static deflection
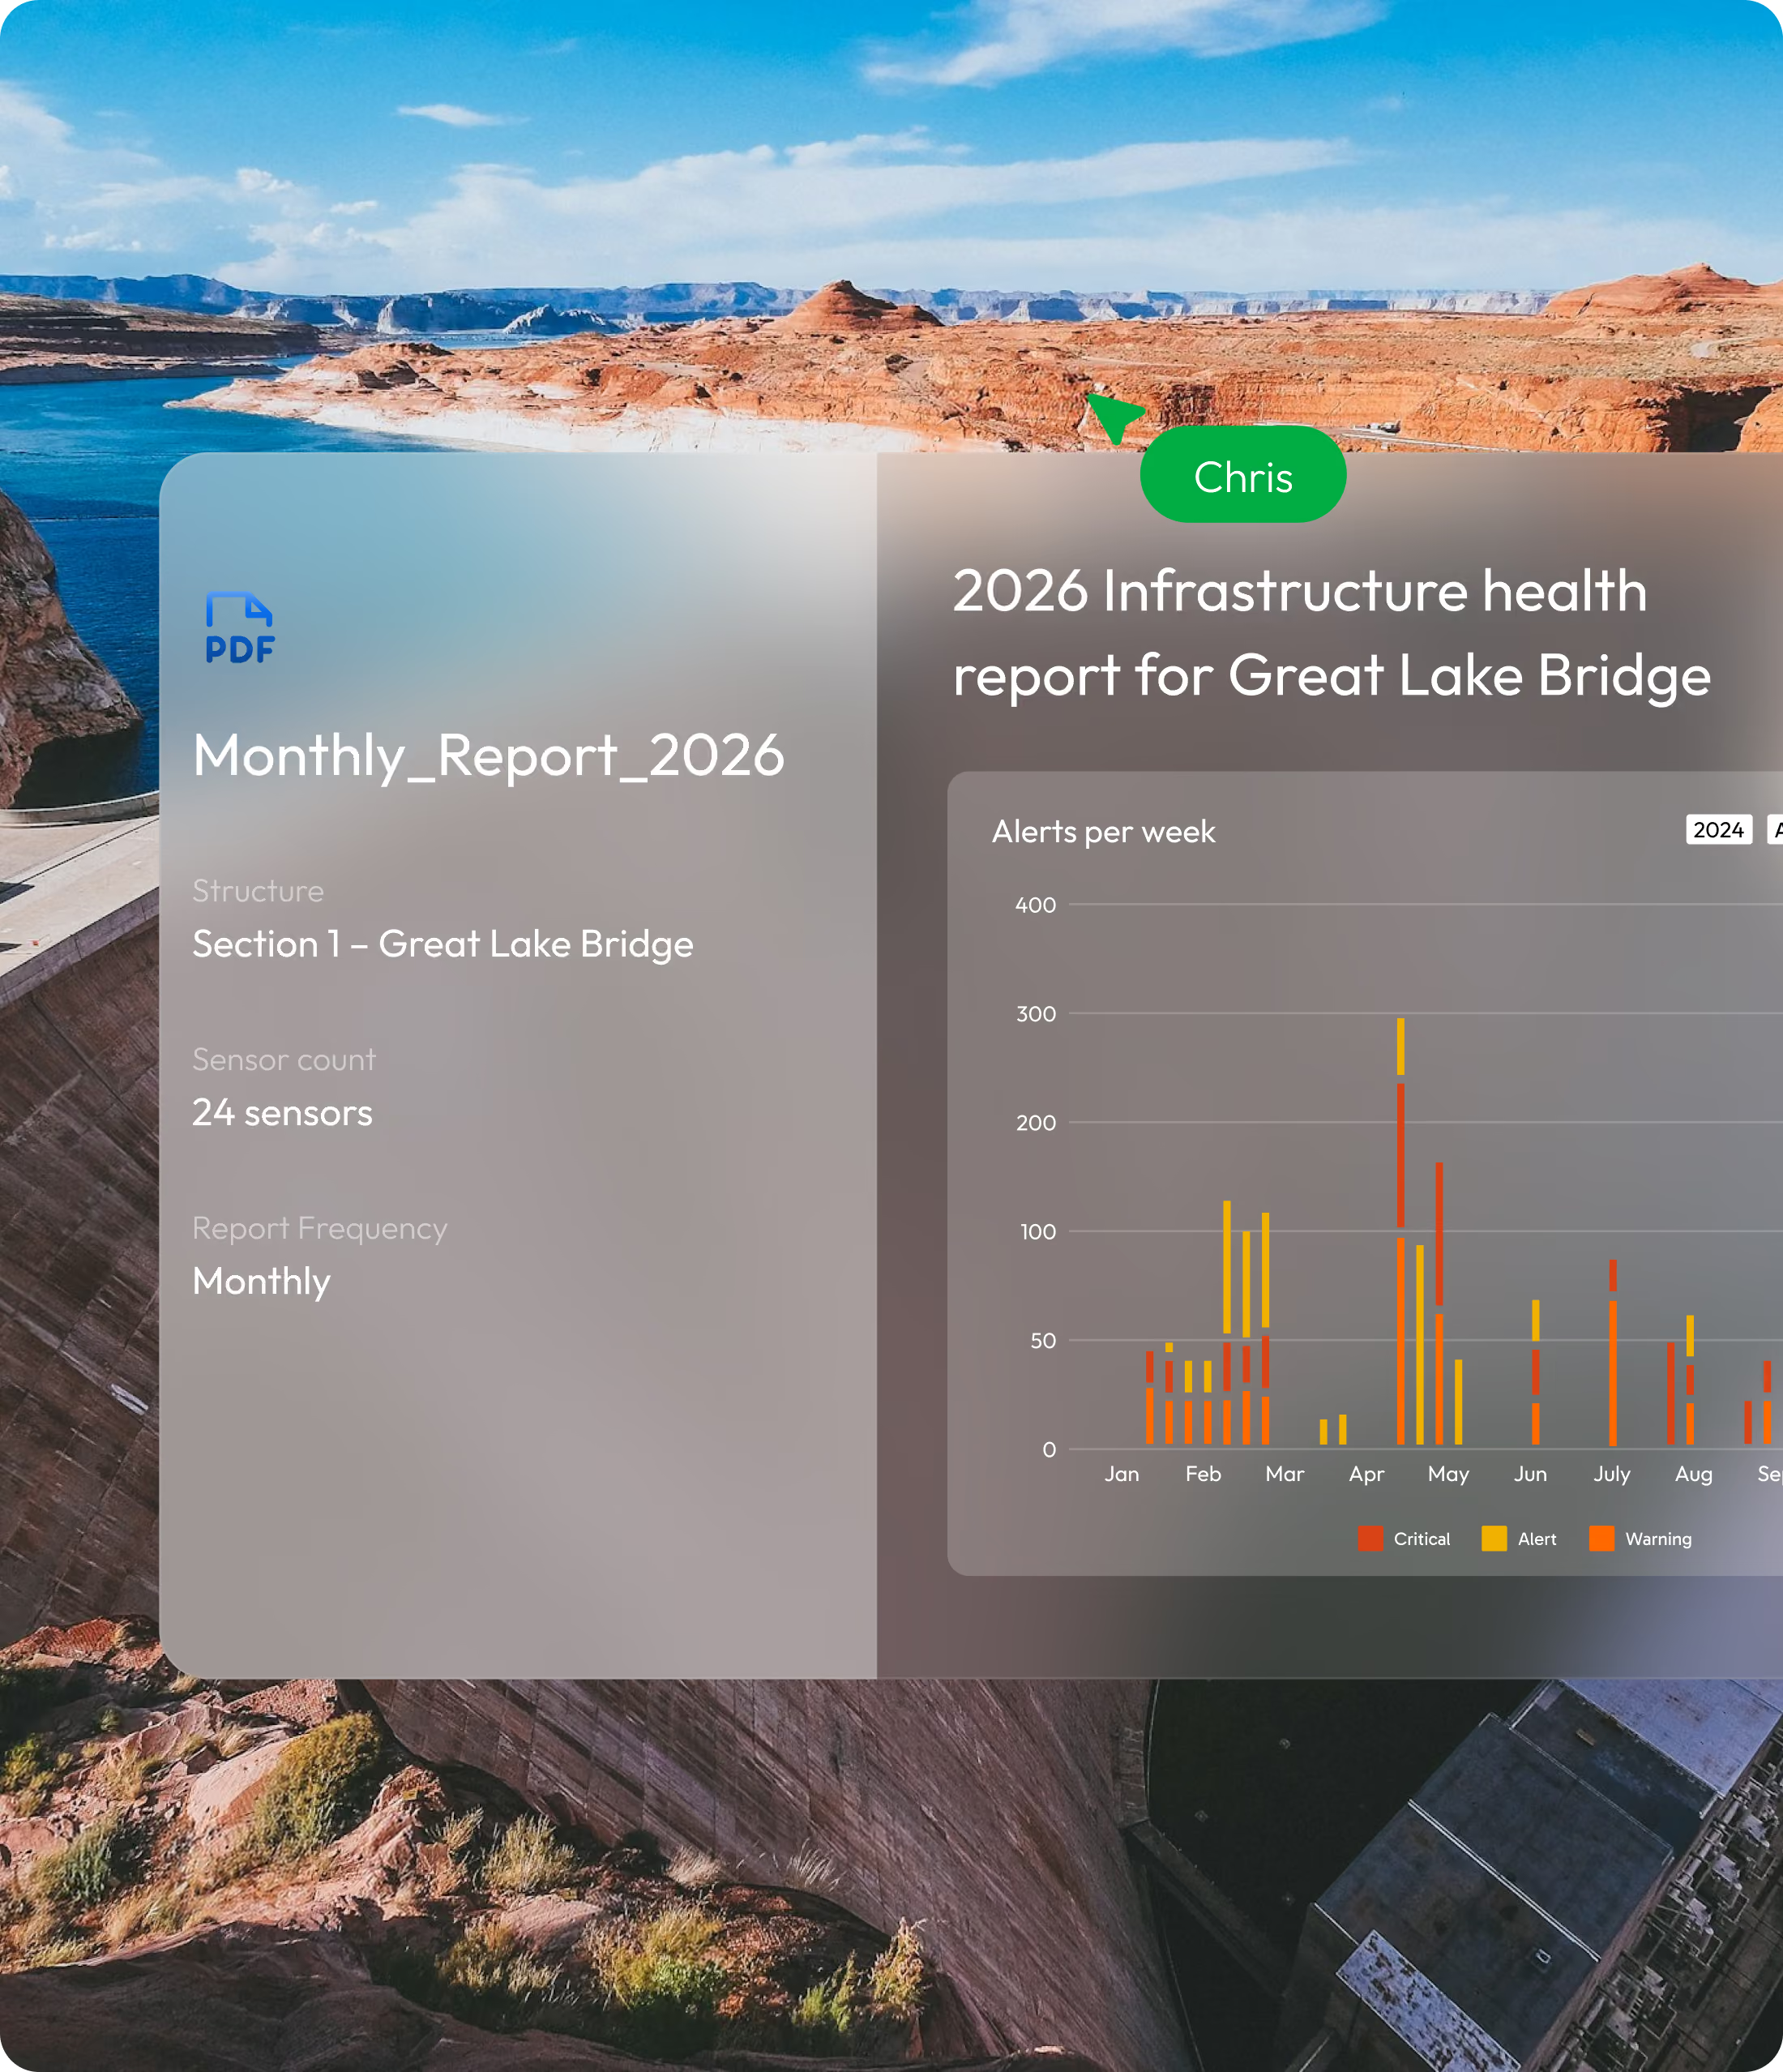

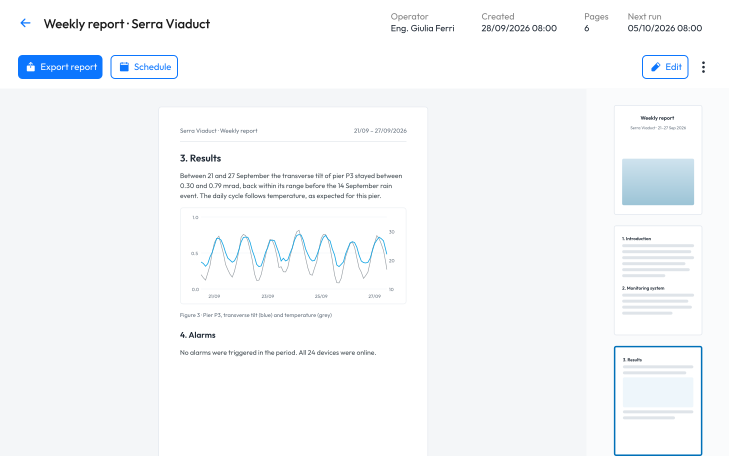
Generate professional reports without the manual work
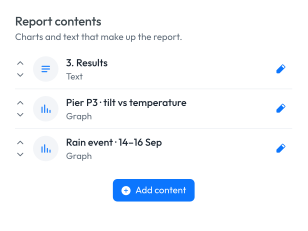
- Template design: Design your template once with charts, tables, notes and your branding.
- Automatic data injection: MyMove populates it with the latest data automatically.
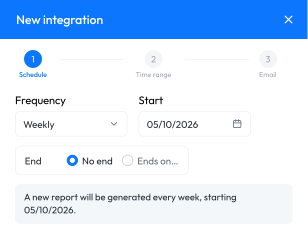
- Scheduled delivery: Schedule weekly, monthly, or custom deliveries directly to your inbox.
- Compliance-ready: Every delivery carries the data and the timestamps your standards require.
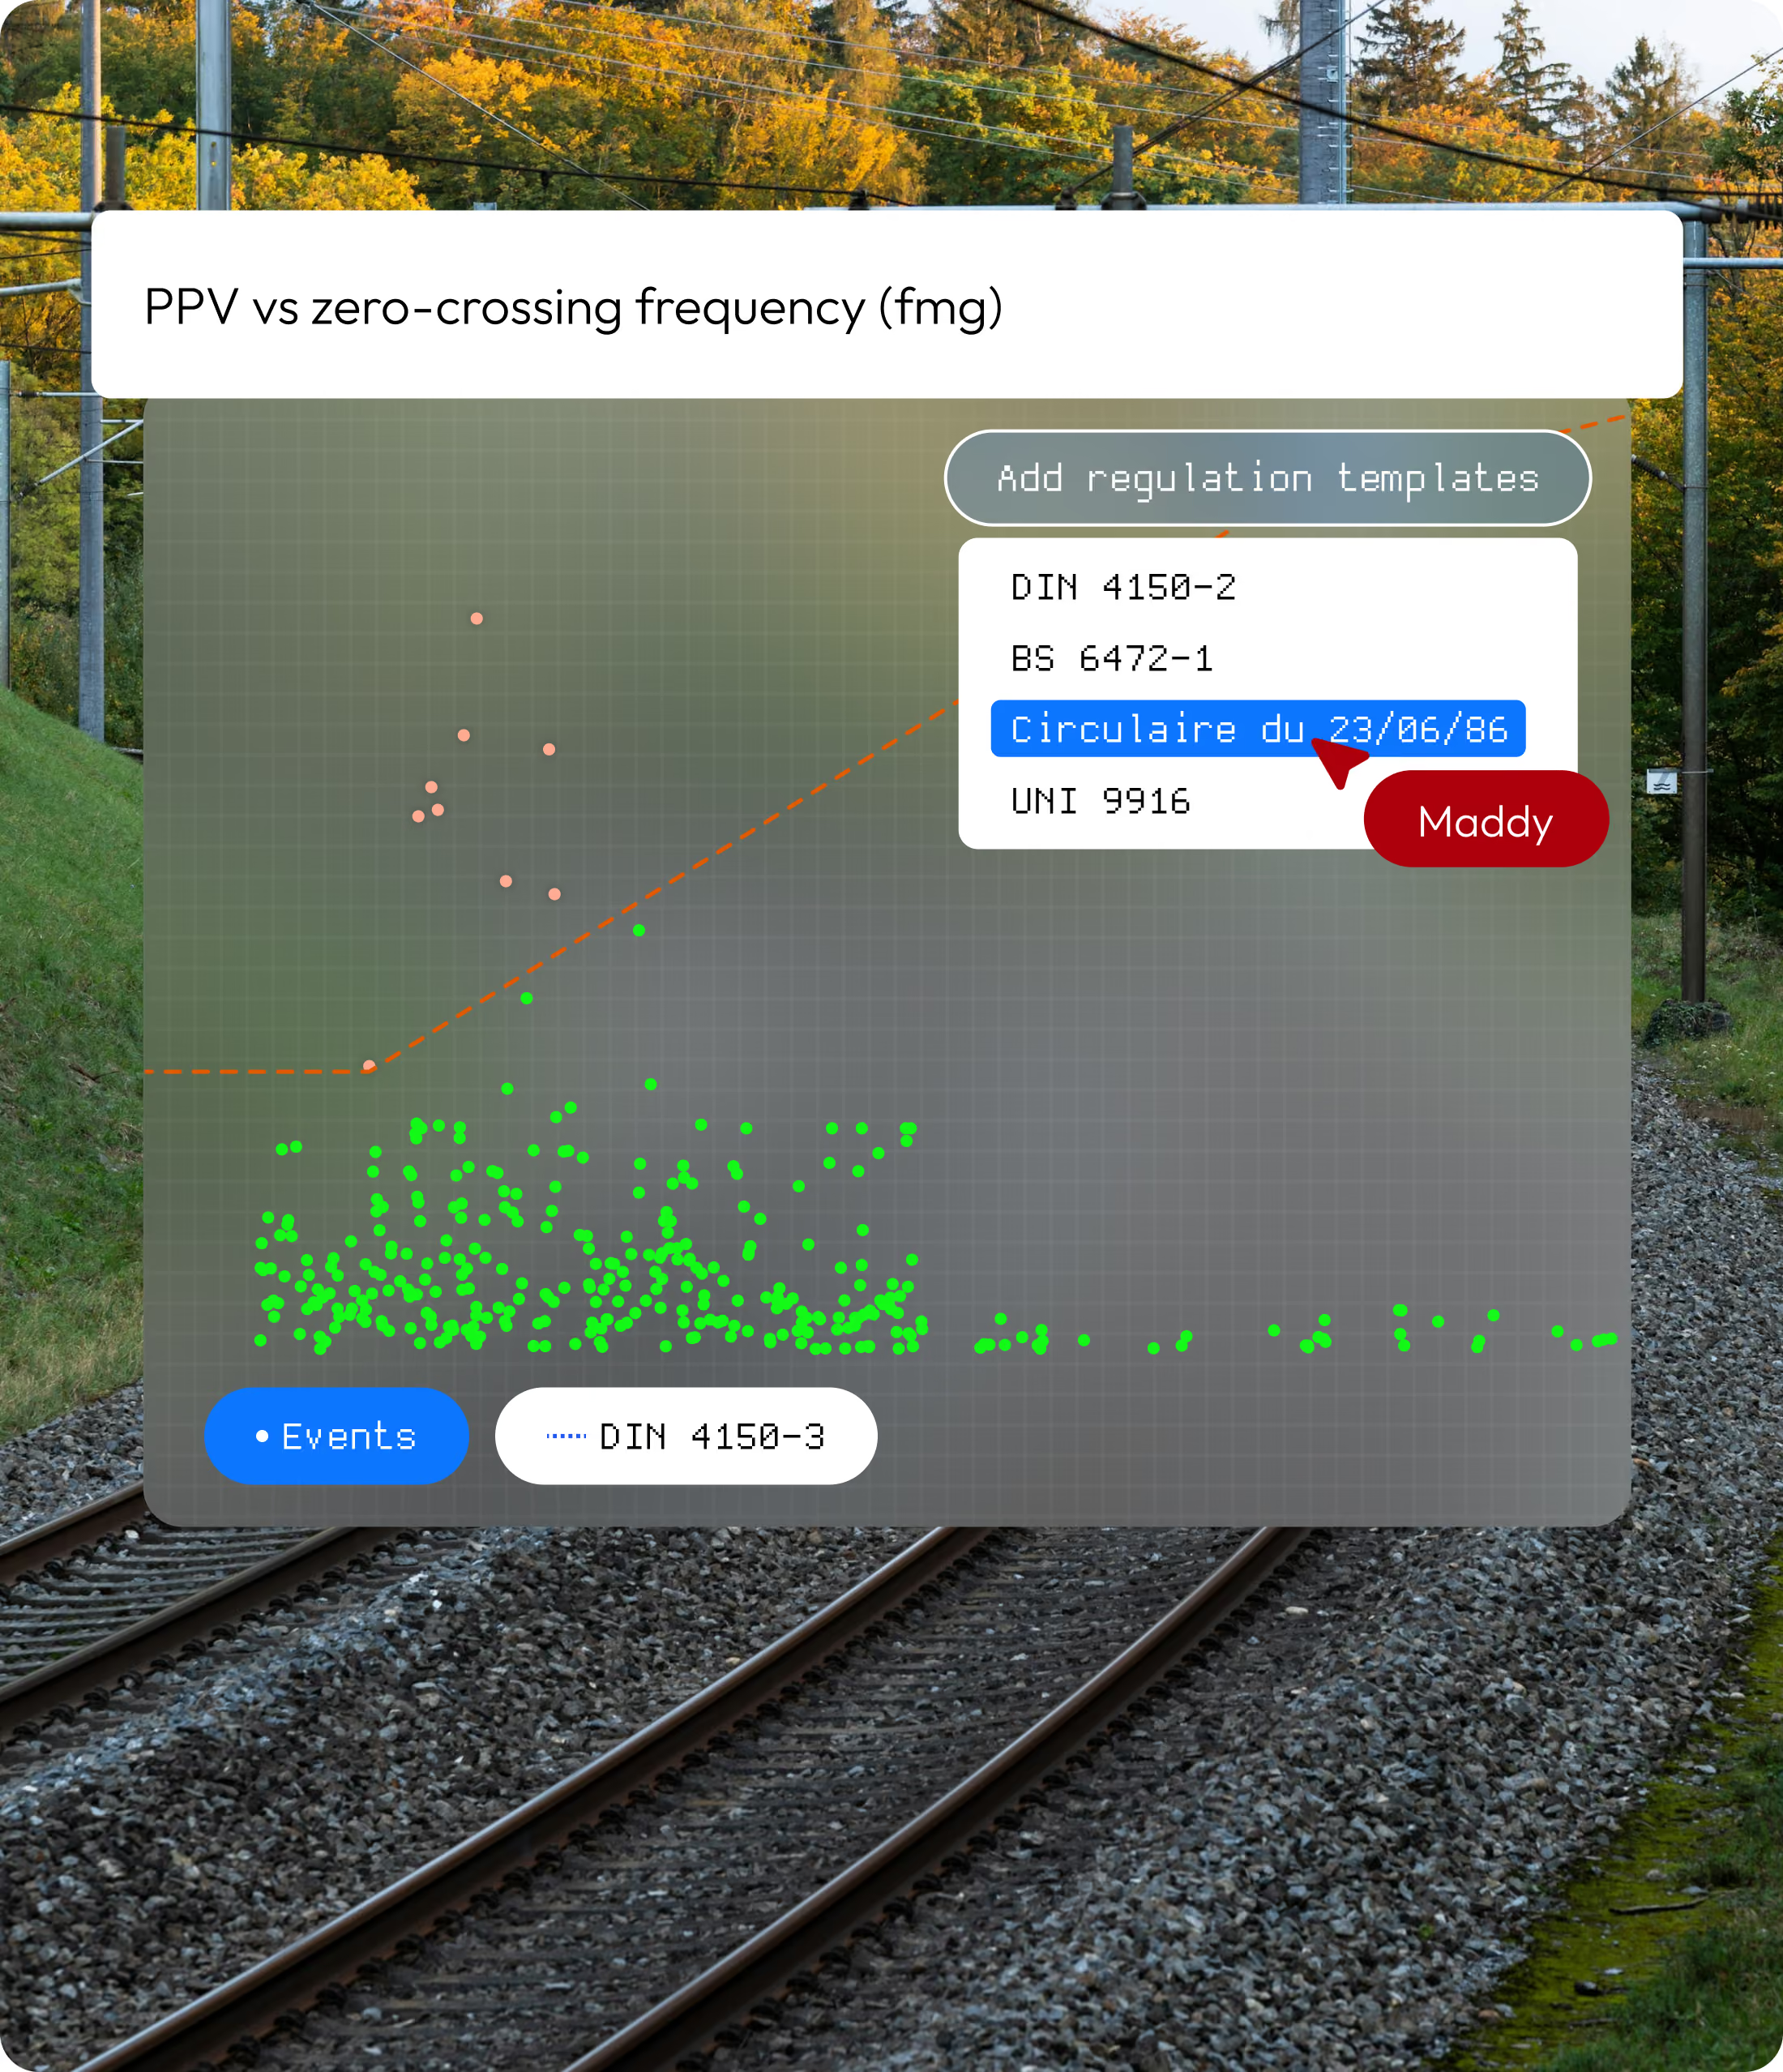

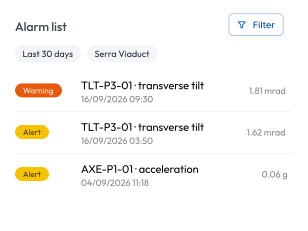
Get notified before a trend becomes a problem
- Threshold rules: Set thresholds on single parameters or combinations
- Regulation-based alerts: Create alerts based on regulations
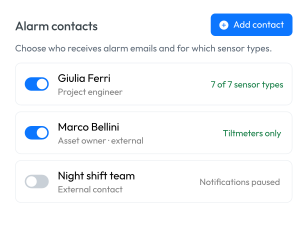
- Instant notifications: Receive alerts via email the moment something crosses a limit
- Audit-ready history: Review alarm history with timestamps and context for audits

Give everyone the right access
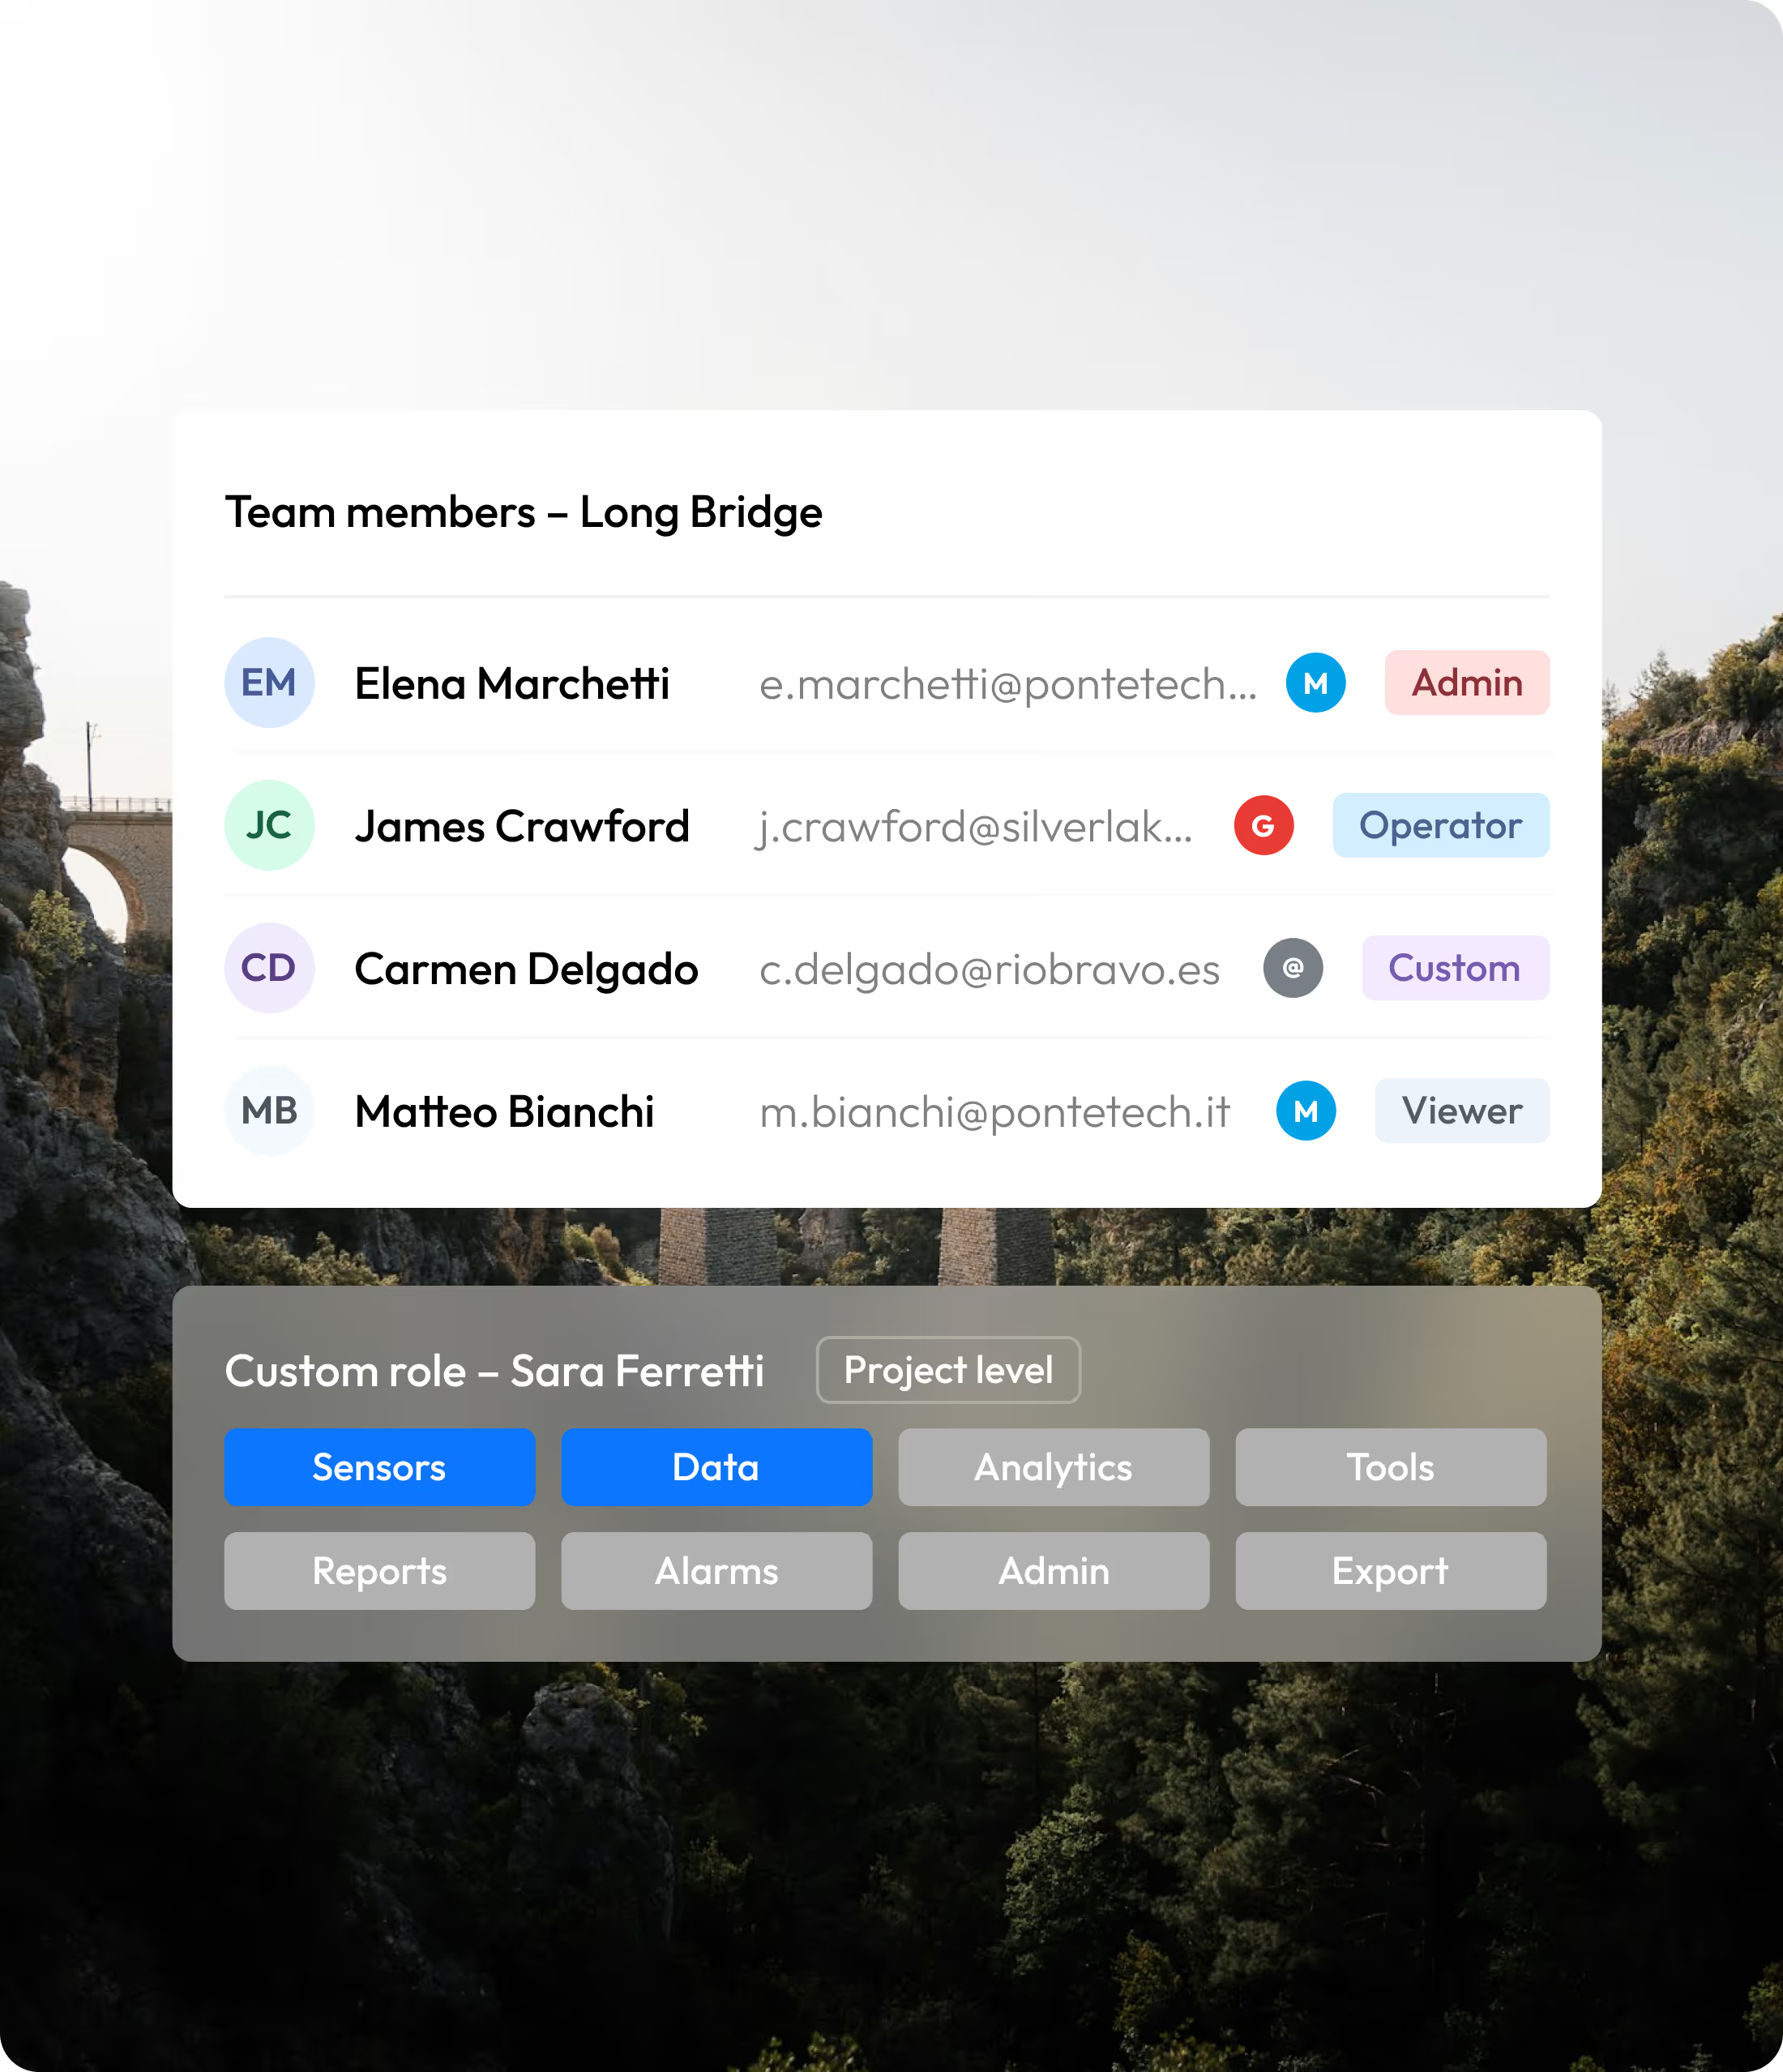
- Self-service accounts: Anyone joins in seconds with email/password, Google, or Microsoft sign-in.
- Three built-in roles: Admin, Operator, Viewer cover the most common cases out of the box.
- Custom roles: Pick exact permissions area by area — sensors, data, analytics, reports, alarms, and more.
- Project-level control: The same person can be Admin on one site and Viewer on another.
- Per-project notifications: Each project alerts the right people — no noise for everyone else.

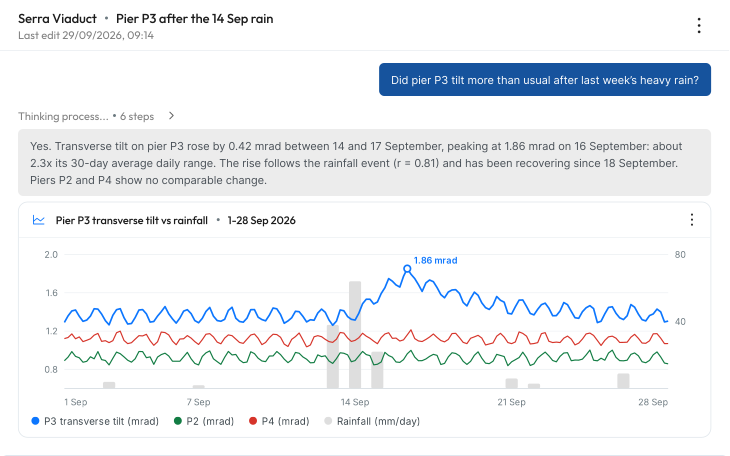
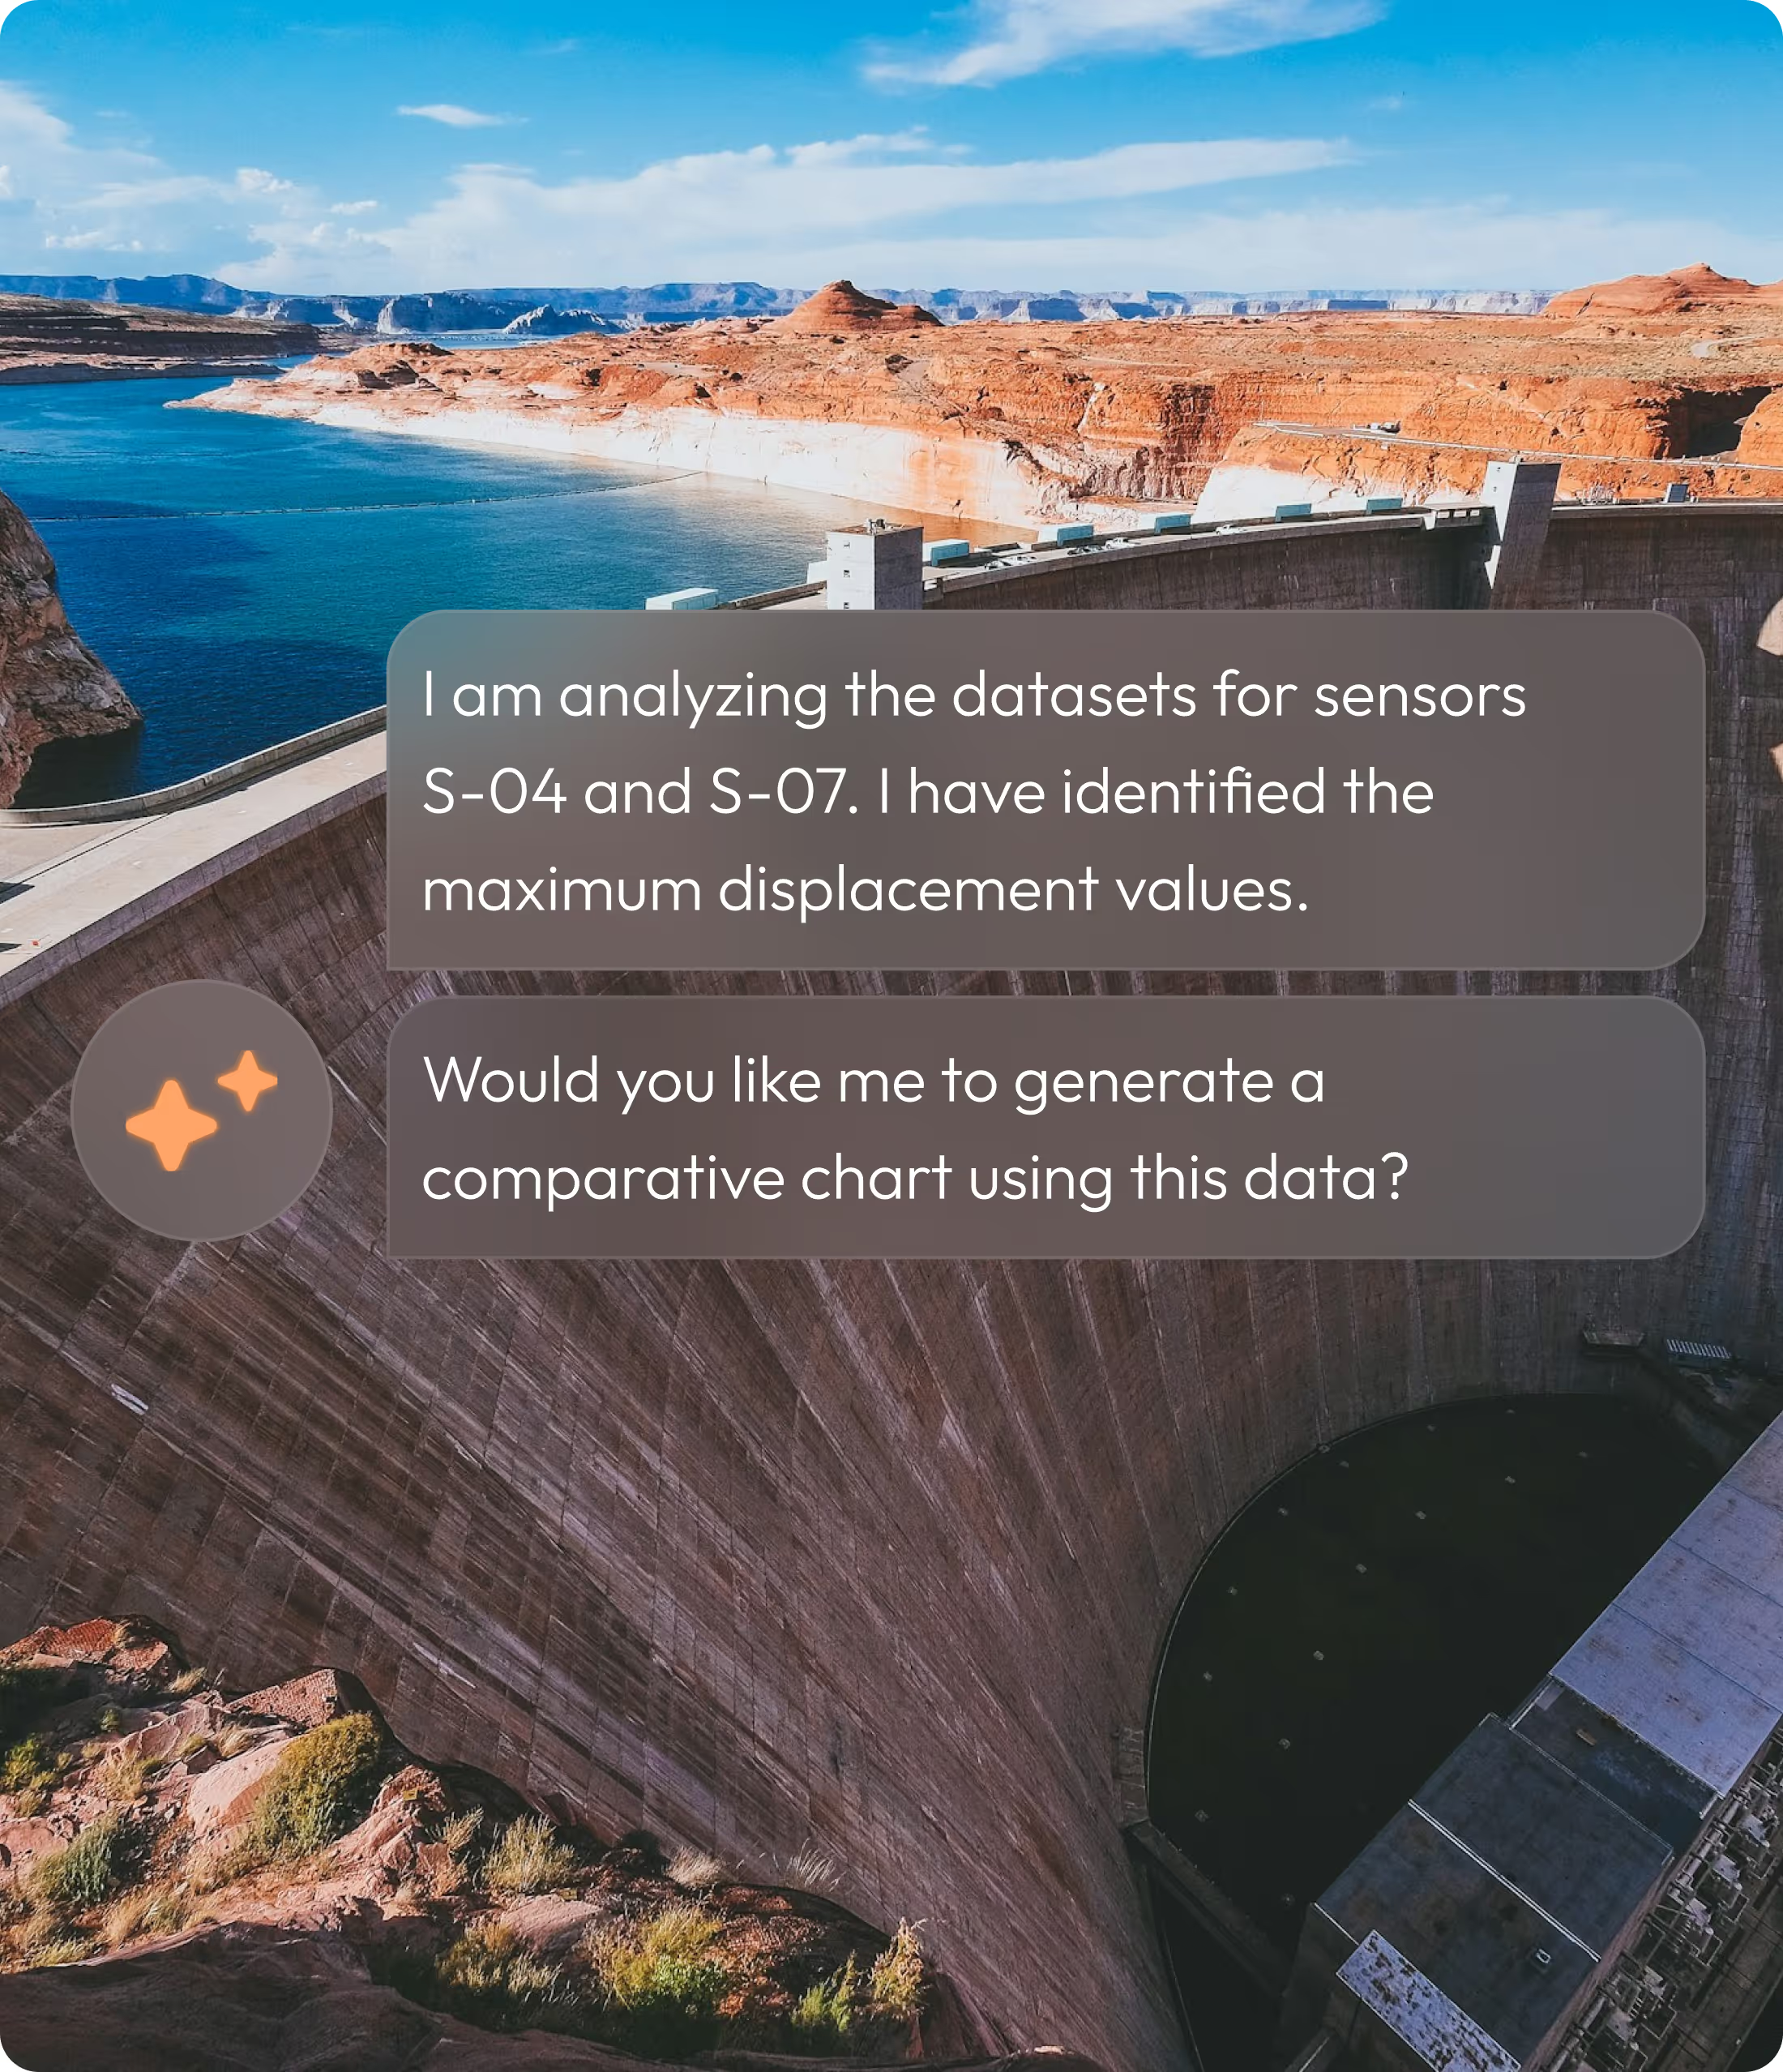
Ask a question. Get the answer, and the reasoning behind it.
- Ask questions in plain language and get instant answers from your asset data — no queries, no dashboards to build.
- It doesn't just fetch numbers, it processes them: moving averages, maxima and minima, filters, correlations — and it shows you every step it took.
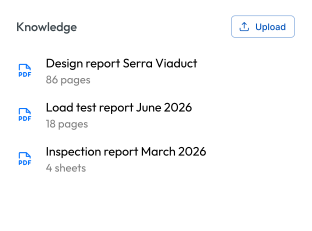
- Upload your project documents — reports, specs, procedures — and the analysis speaks your project's language.
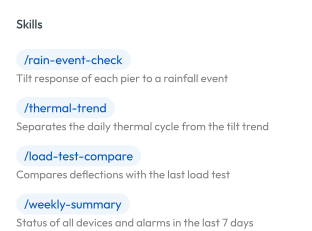
- Turn an analysis you repeat into a reusable skill, and recall it any time with a single prompt.
All your advanced analysis tools. One environment.
Railway
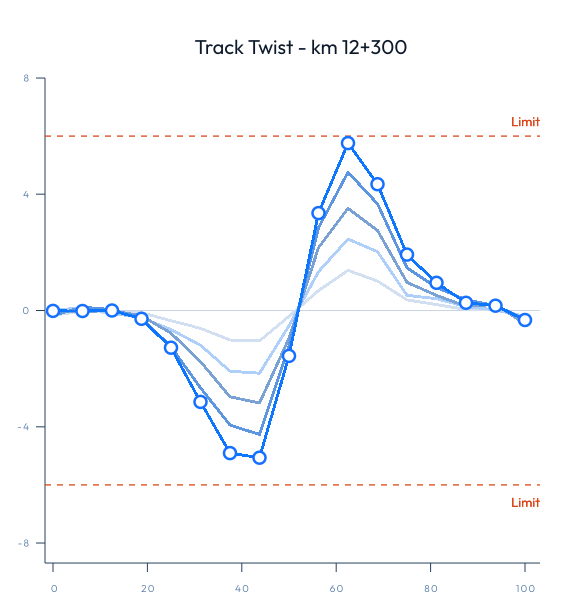
Generate the curvature profile of a static deflection for a span or deck from a group of wireless tiltmeters. Overlay profiles from different timestamps to evaluate repeatability, symmetry, and stiffness variations.
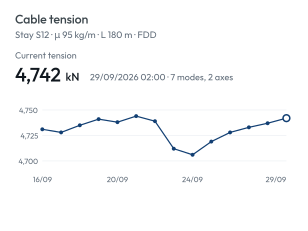
Cable tension
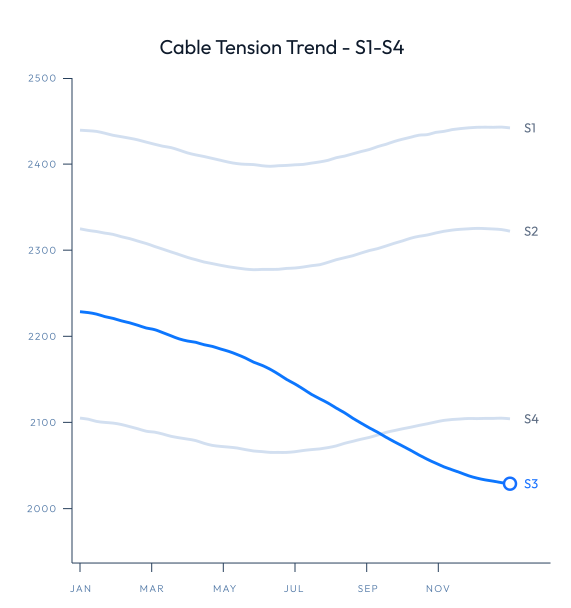
Generate the curvature profile of a static deflection for a span or deck from a group of wireless tiltmeters. Overlay profiles from different timestamps to evaluate repeatability, symmetry, and stiffness variations.
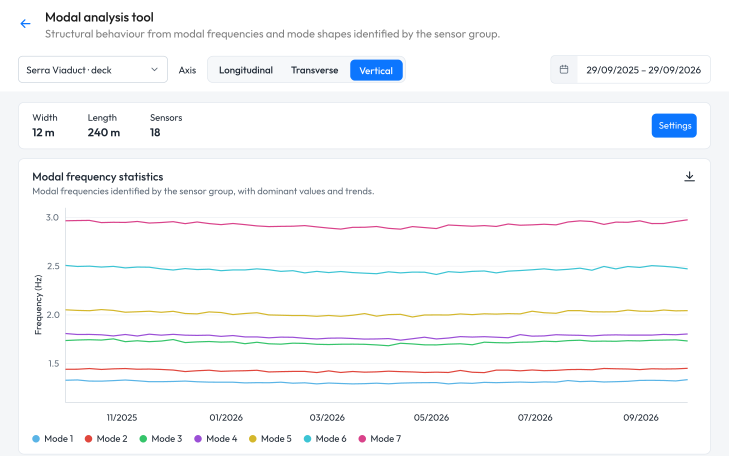
Modal analysis
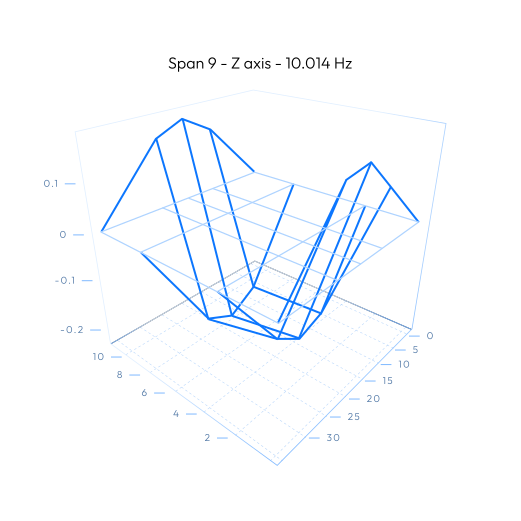
Extract frequencies, damping, and mode shapes from synchronized accelerometers. Visualize 3D deformation patterns across your structure. Track how modal behavior changes over time and catch stiffness loss early.
Tiltmeter chain
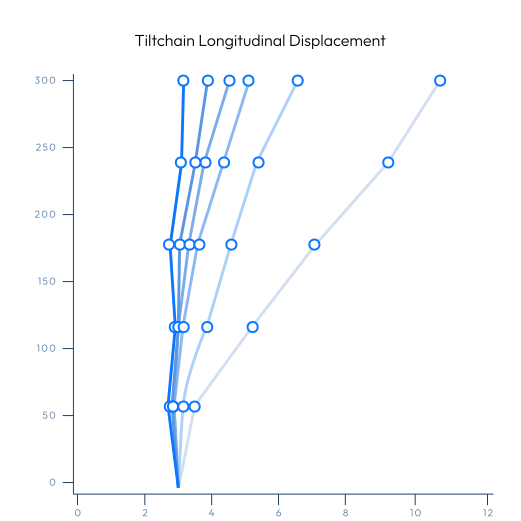
The Tiltchain Tool provides detailed deformation profiles and displacement trends by analyzing angular variations along chained tiltmeters — ideal for tracking structural movement over time.
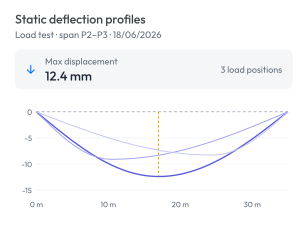
Static deflection
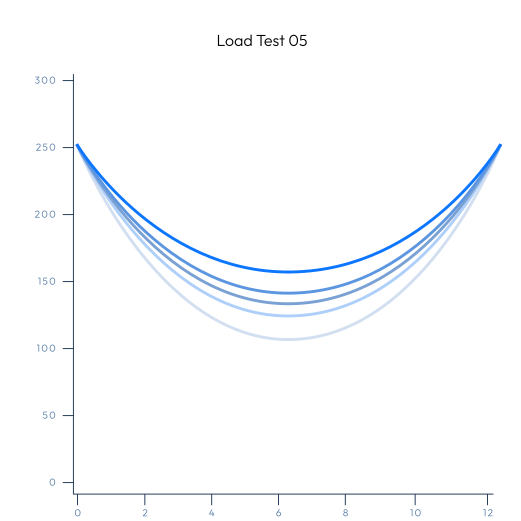
Generate the curvature profile of a static deflection for a span or deck from a group of wireless tiltmeters. Overlay profiles from different timestamps to evaluate repeatability, symmetry, and stiffness variations.
Already have sensors? Bring them in.
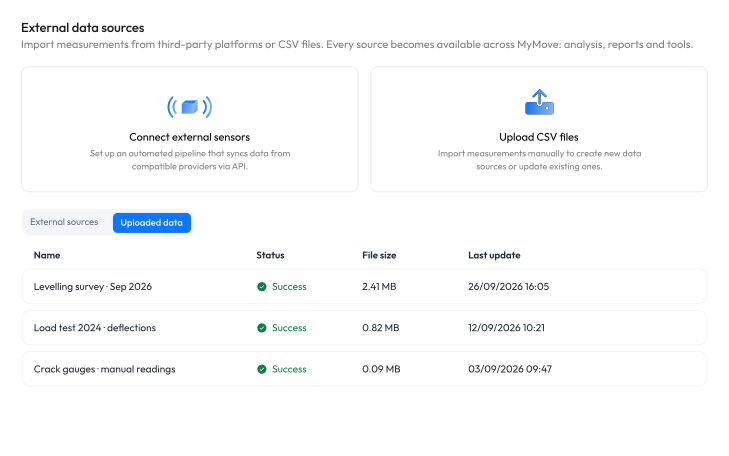
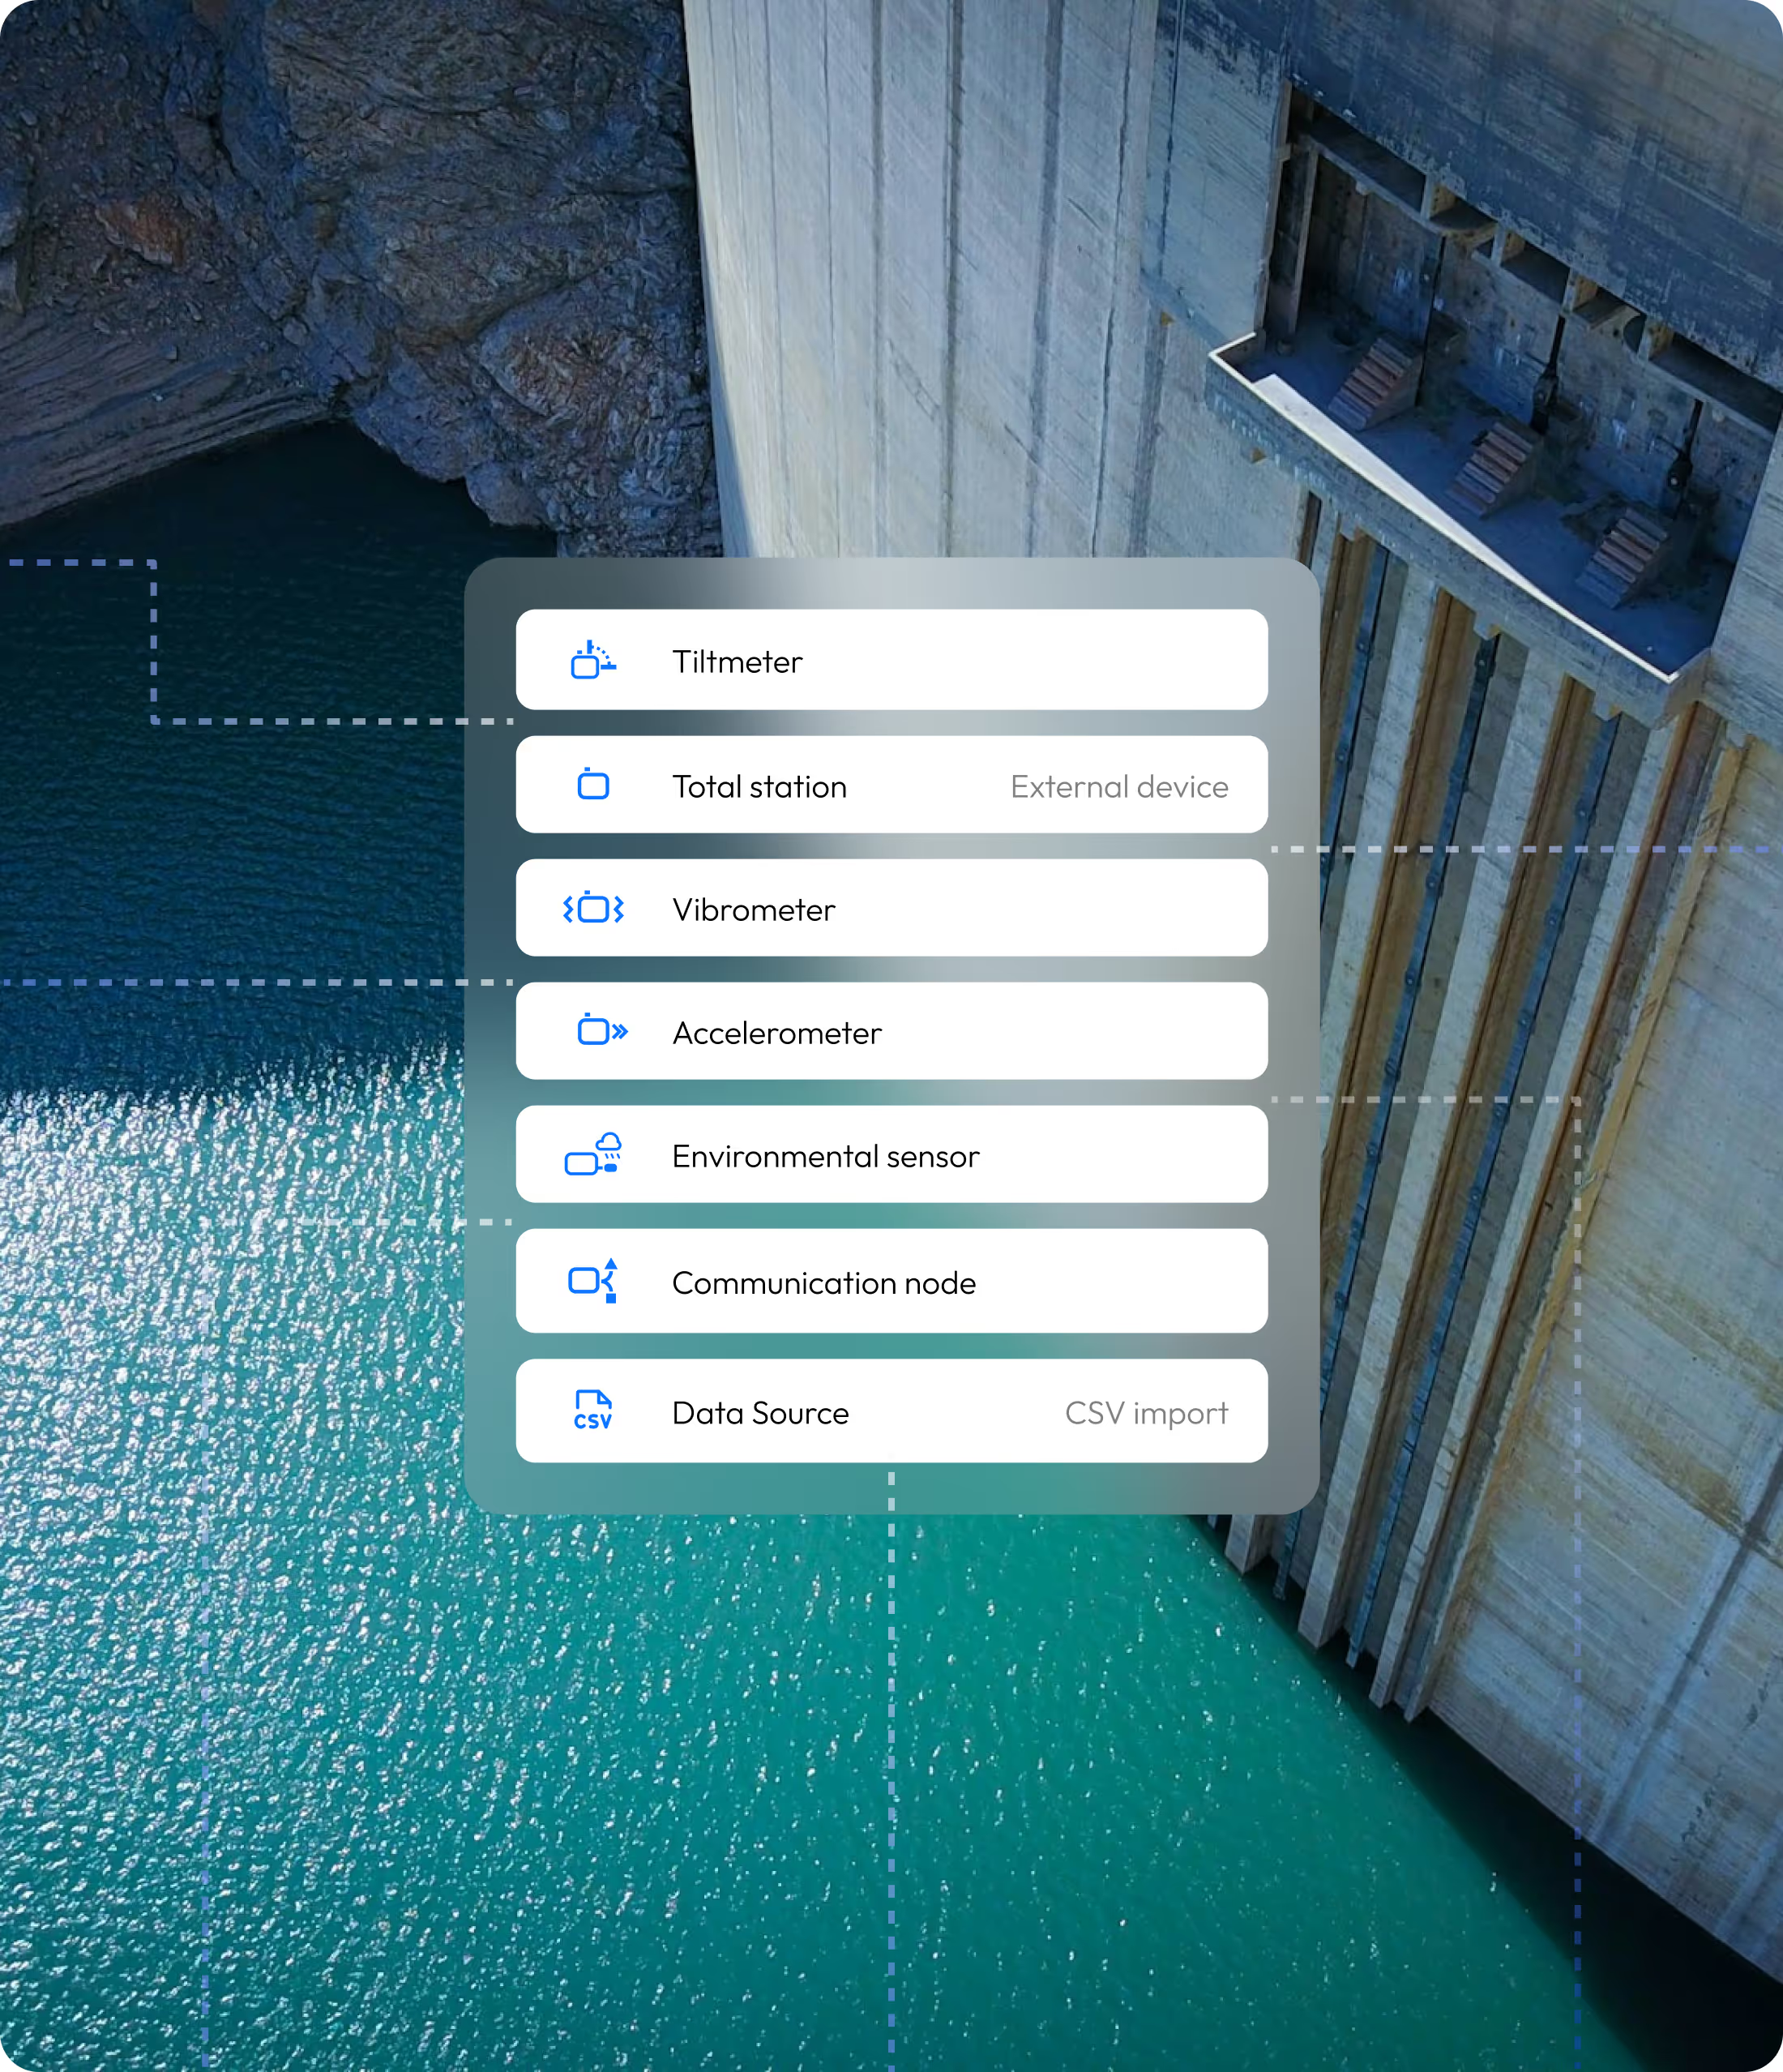
- Upload CSV files from Total Stations, vibrating wire sensors, weather stations, and every data source you need to integrate in your project.
- Map third-party device data to your projects seamlessly and correlate them on MyMove
See MyMove in action
Book a 20-minute demo with our experts and discover how MyMove can unify all your monitoring data into one intelligent platform.