Non-invasive monitoring for buildings and heritage structures
Non-invasive monitoring for historic buildings and critical assets.

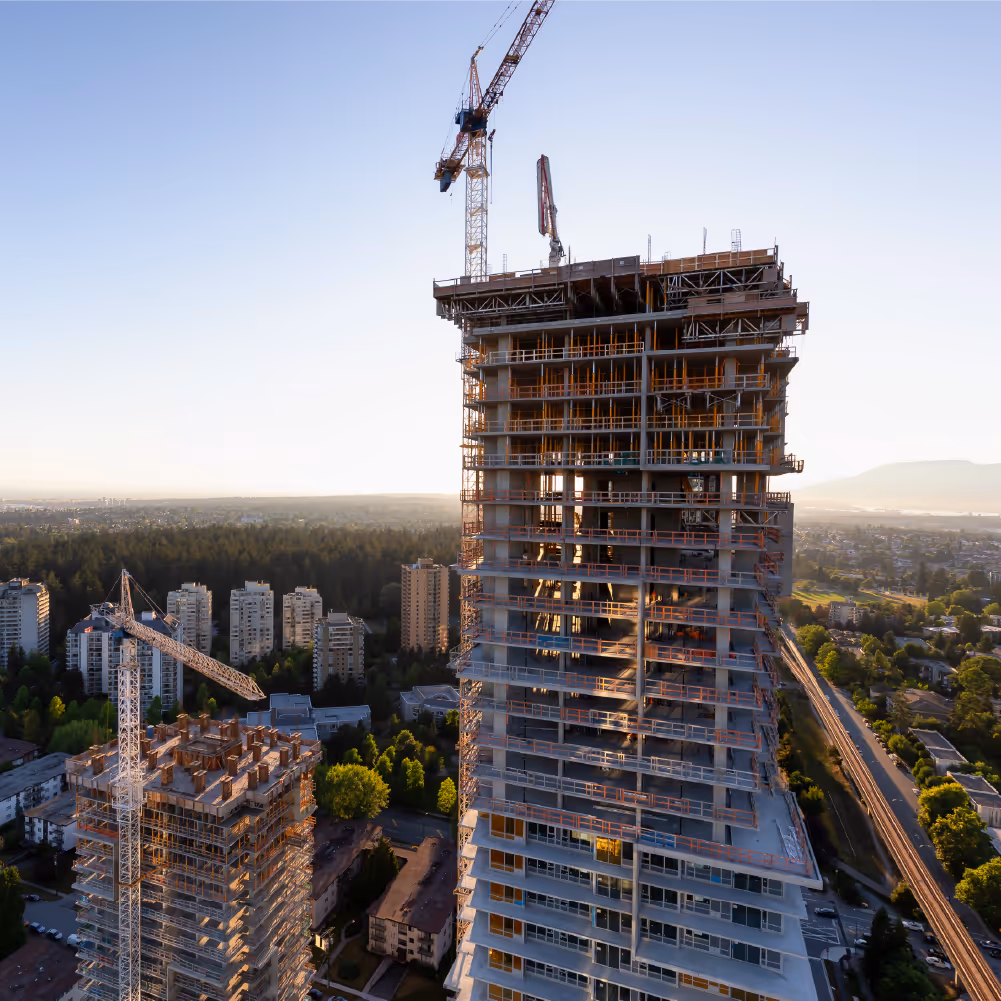
Why monitor buildings and heritage structures?
Existing buildings and historical assets are vulnerable to structural movement caused by differential settlement, adjacent construction, seismic activity, and material aging. Monitoring these deformations is critical to ensure safety, plan interventions, and comply with conservation and restoration requirements.
How structural monitoring system works
From sensor installation to data analysis, Move Solutions delivers a fully wireless structural health monitoring solution.
Deploy wireless devices on site. Sensors connect automatically via LoRaWAN.
Data flows to the cloud and is managed in MyMove, remotely and in real time.
Turn raw data into engineering insights with advanced built-in Tools for smart structural analysis.
Generate customized PDF reports automatically—ready to share with contractors, stakeholders, or authorities.
Why choose Move Solutions for building and heritage monitoring
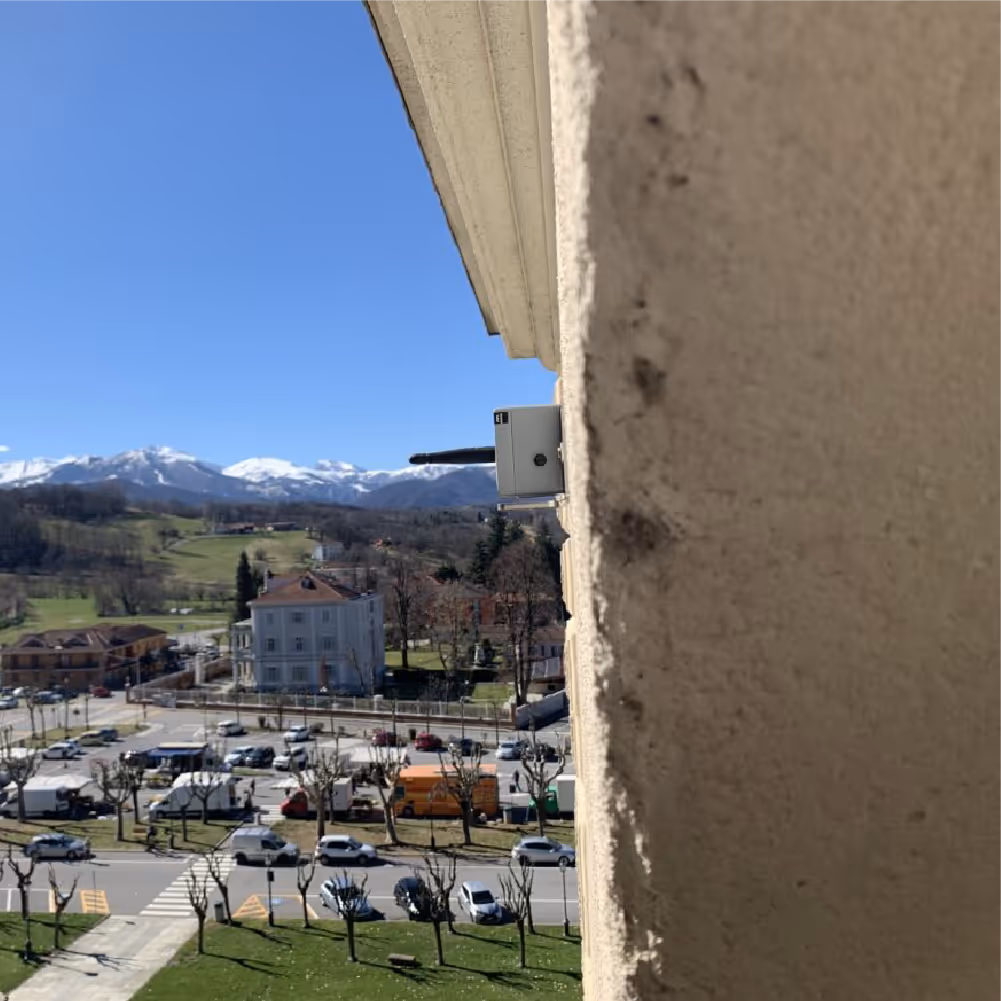
Protect structural integrity with a non-invasive, wireless system ideal for sensitive environments. Move Solutions allows you to monitor tilt, vibration, settlement, and environmental effects—preserving safety without compromising architectural value.
Key points of structural monitoring
.avif)

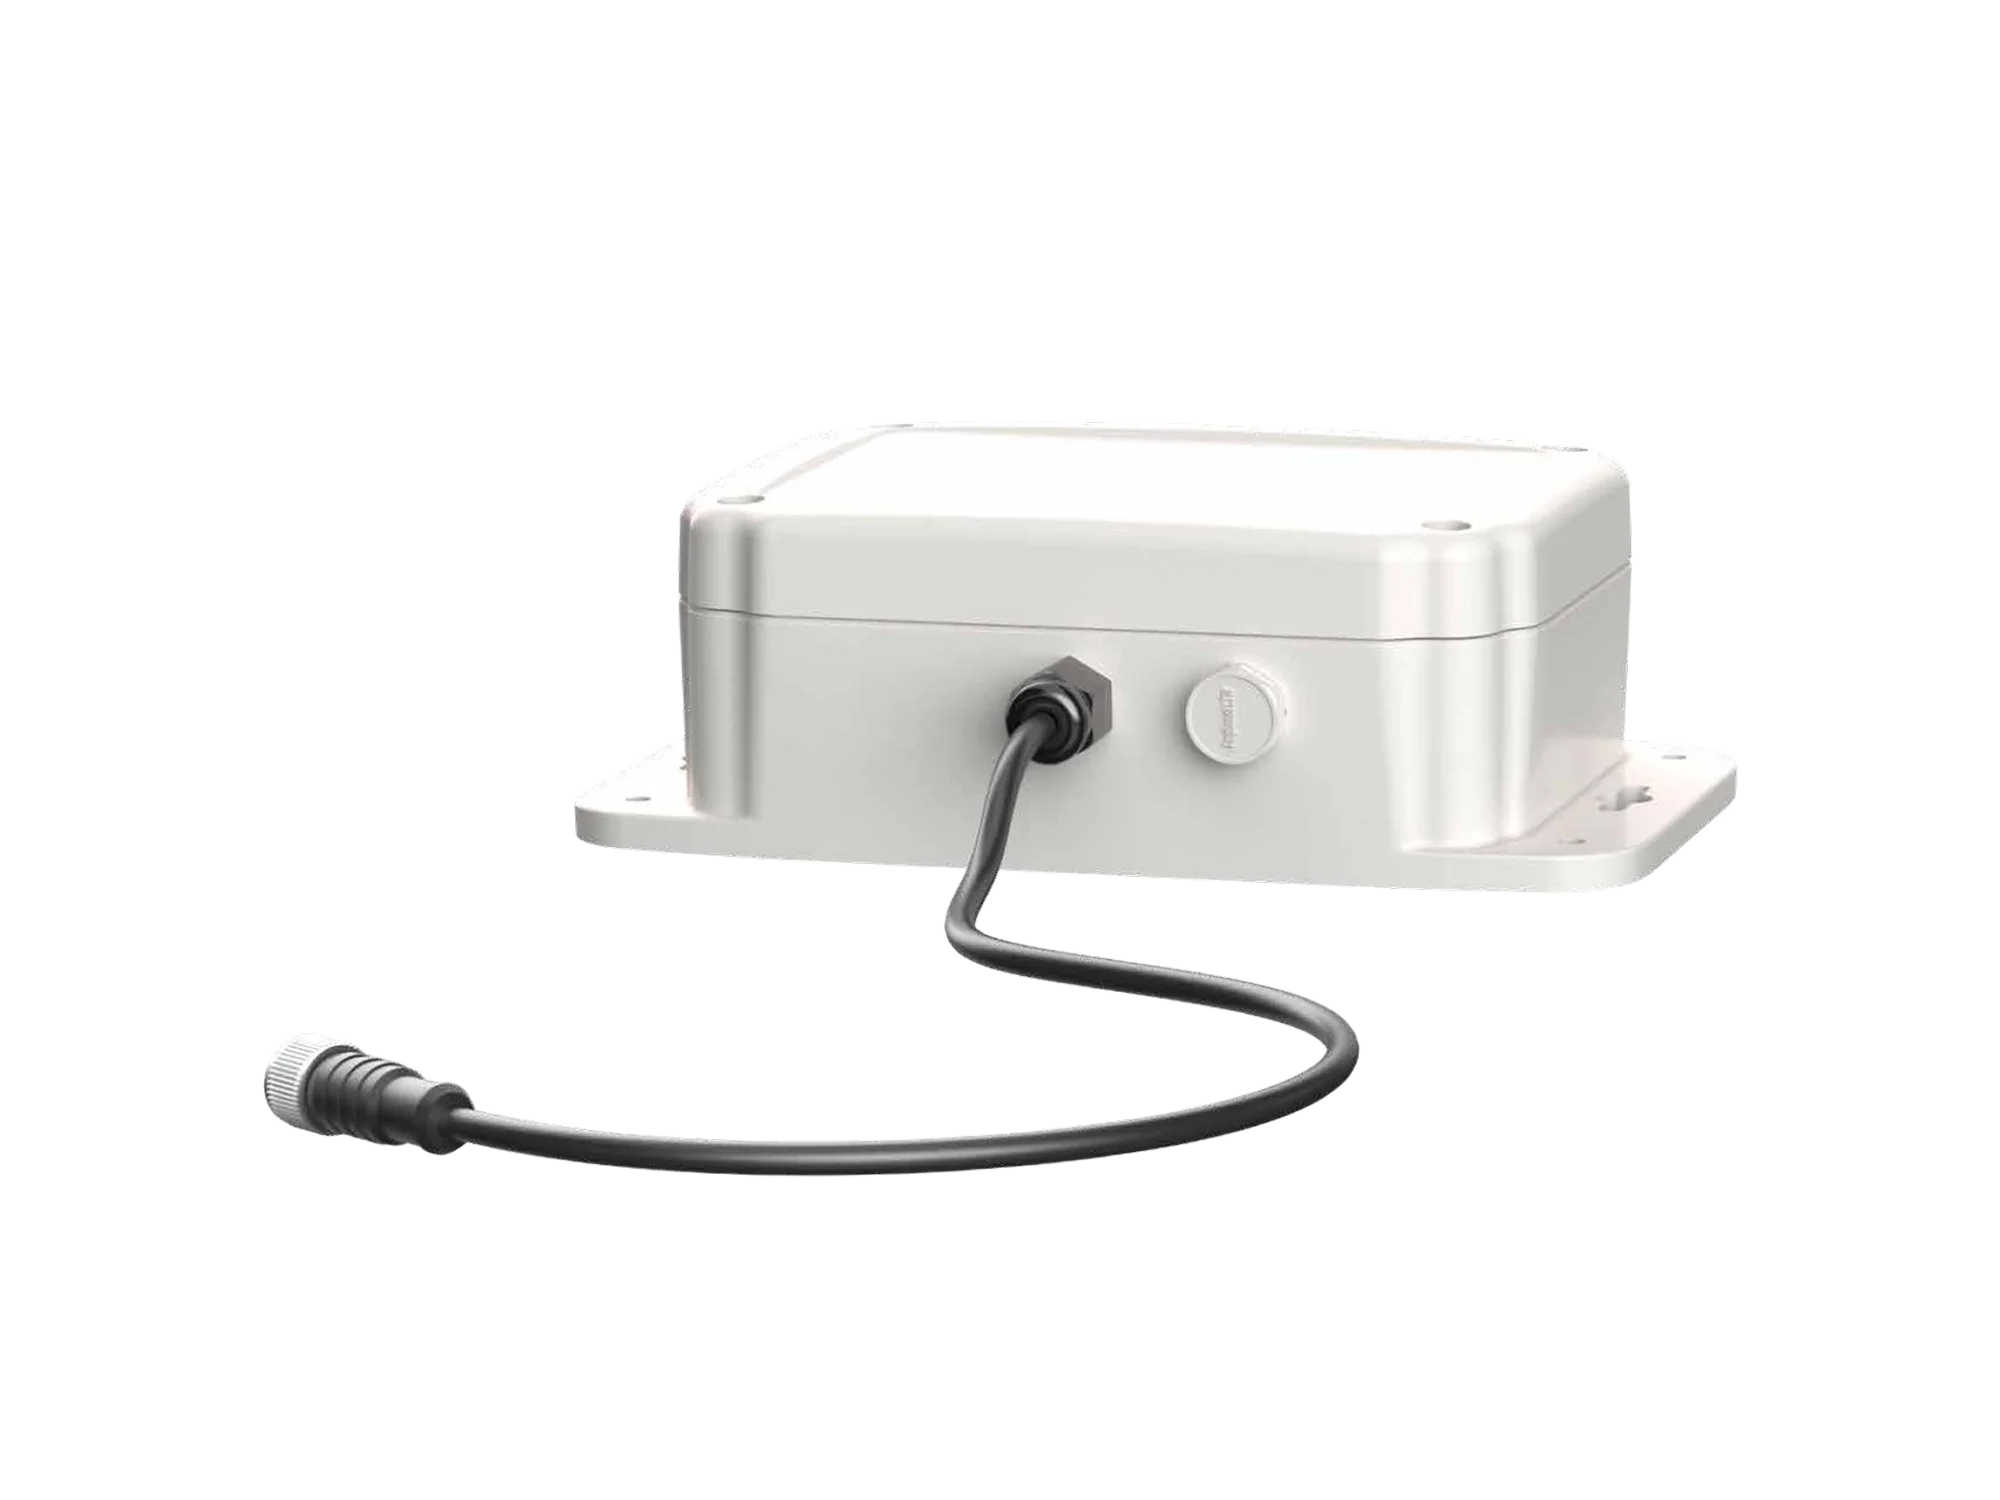
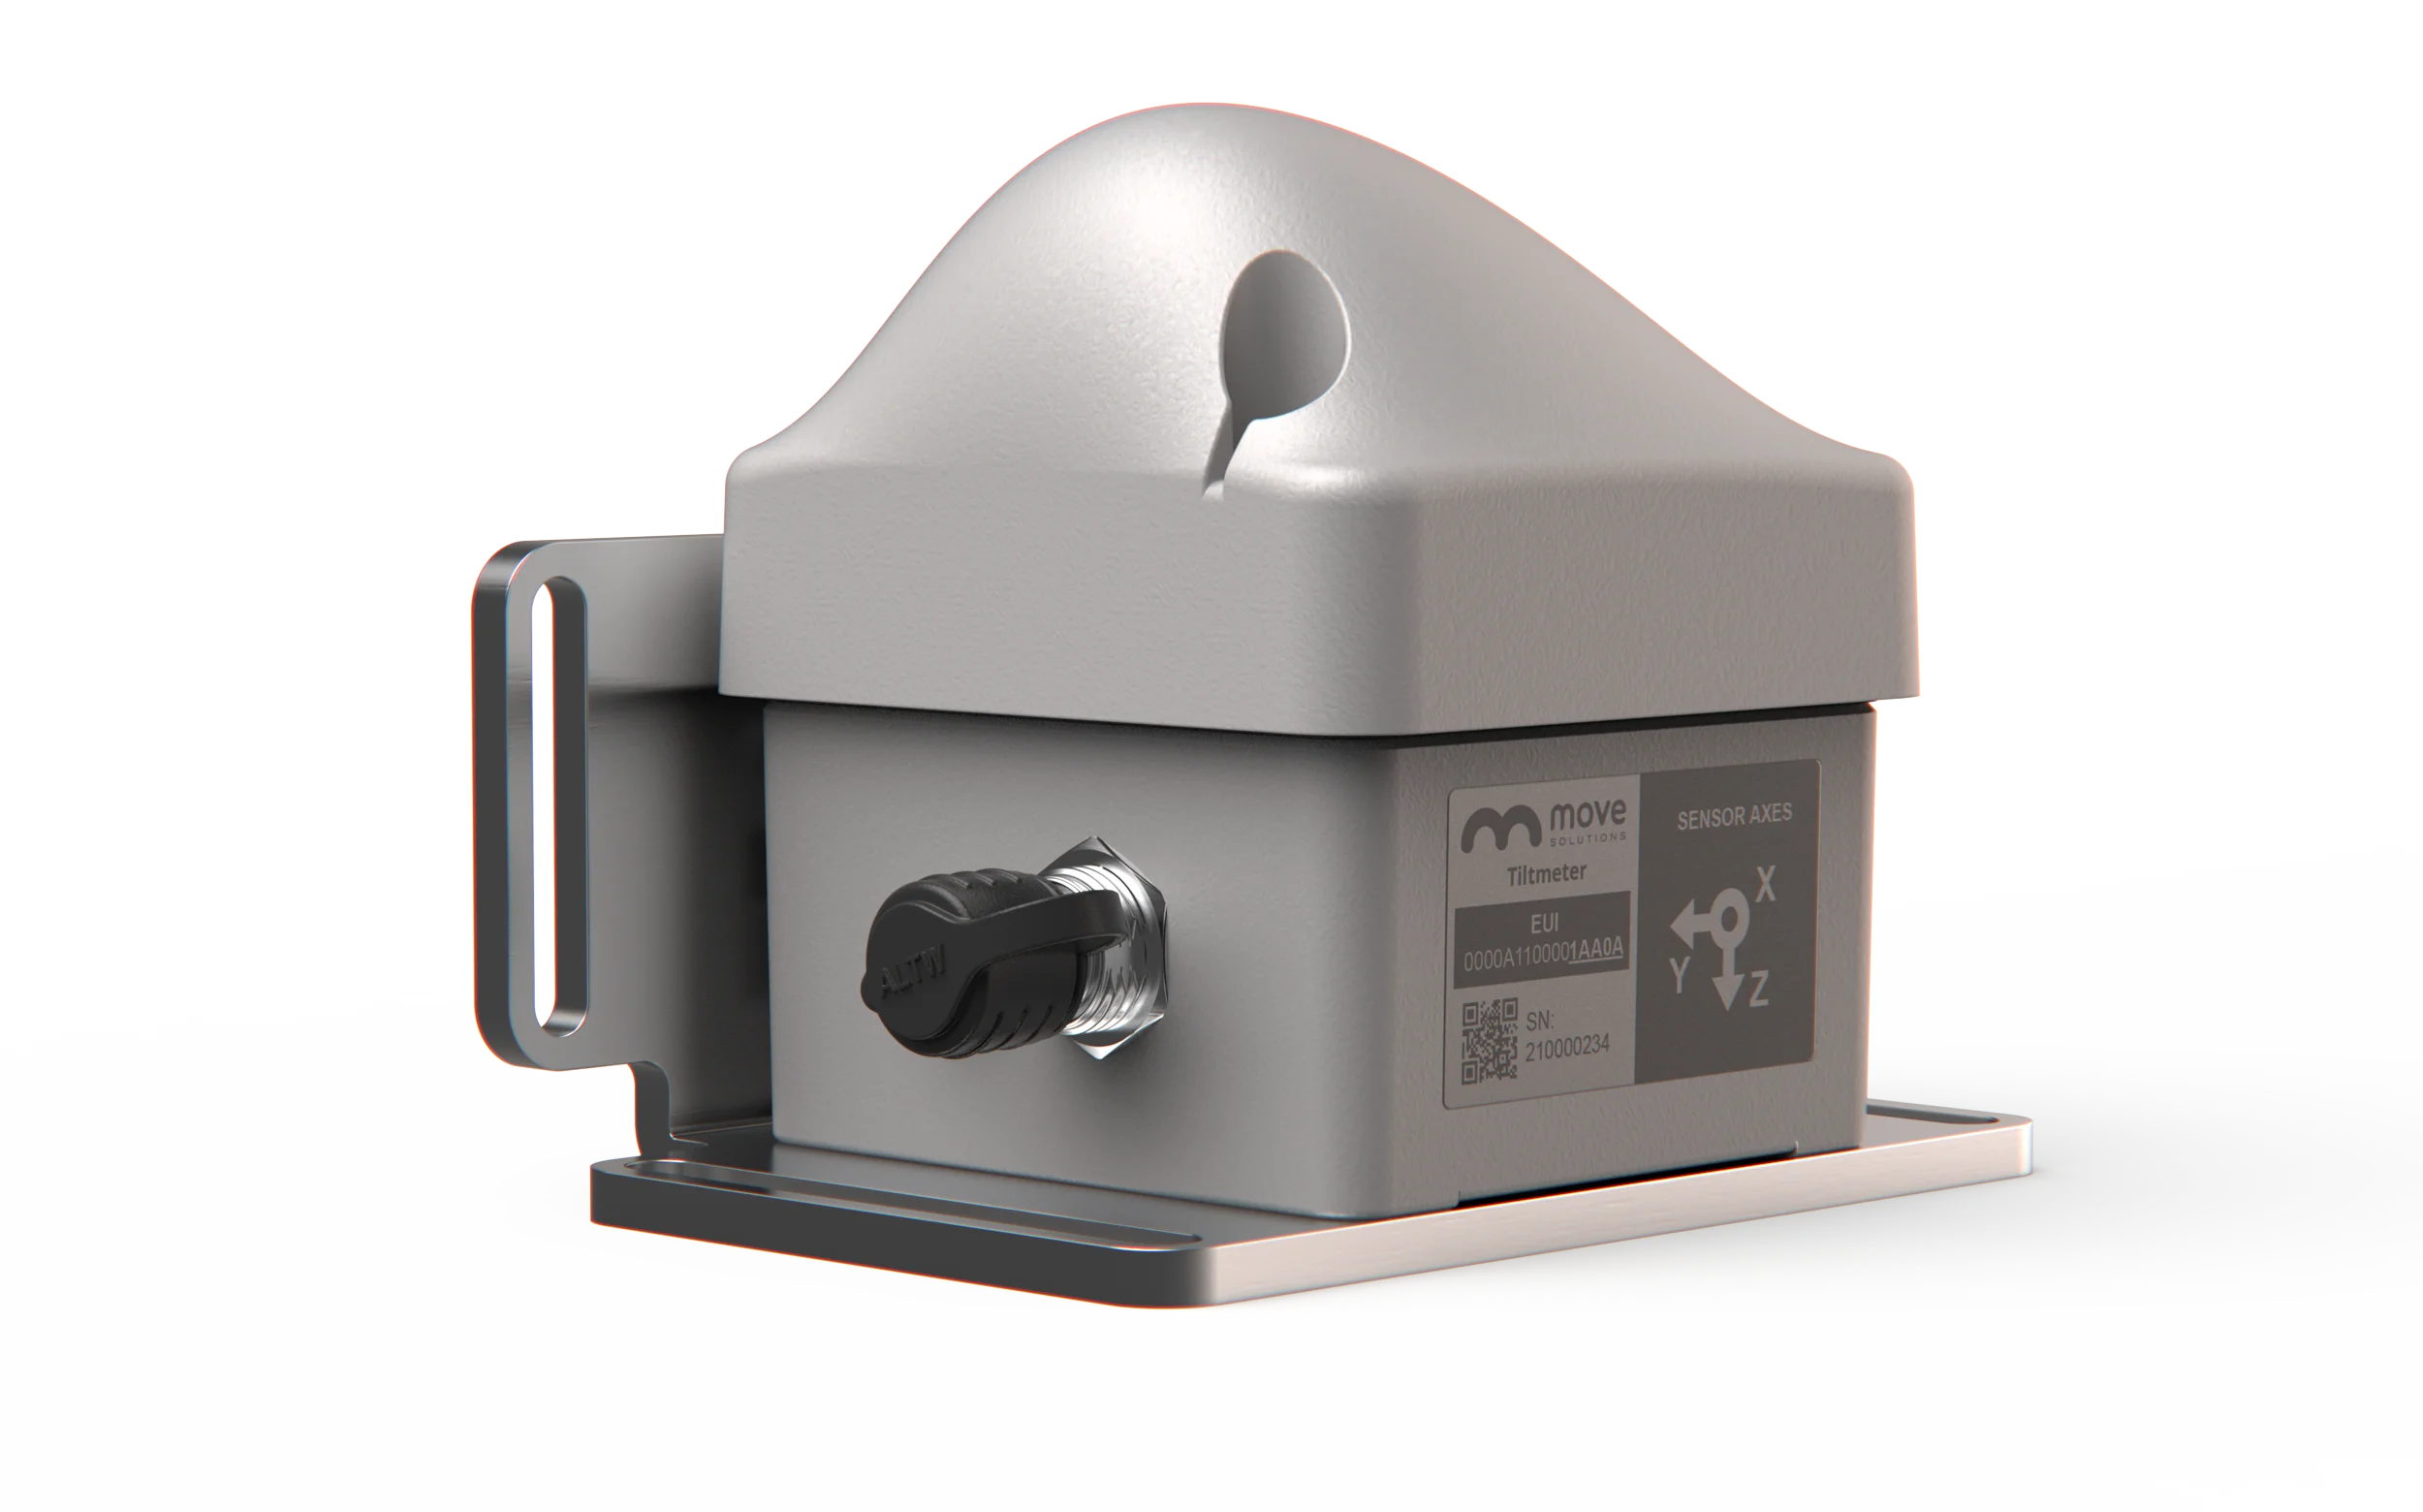
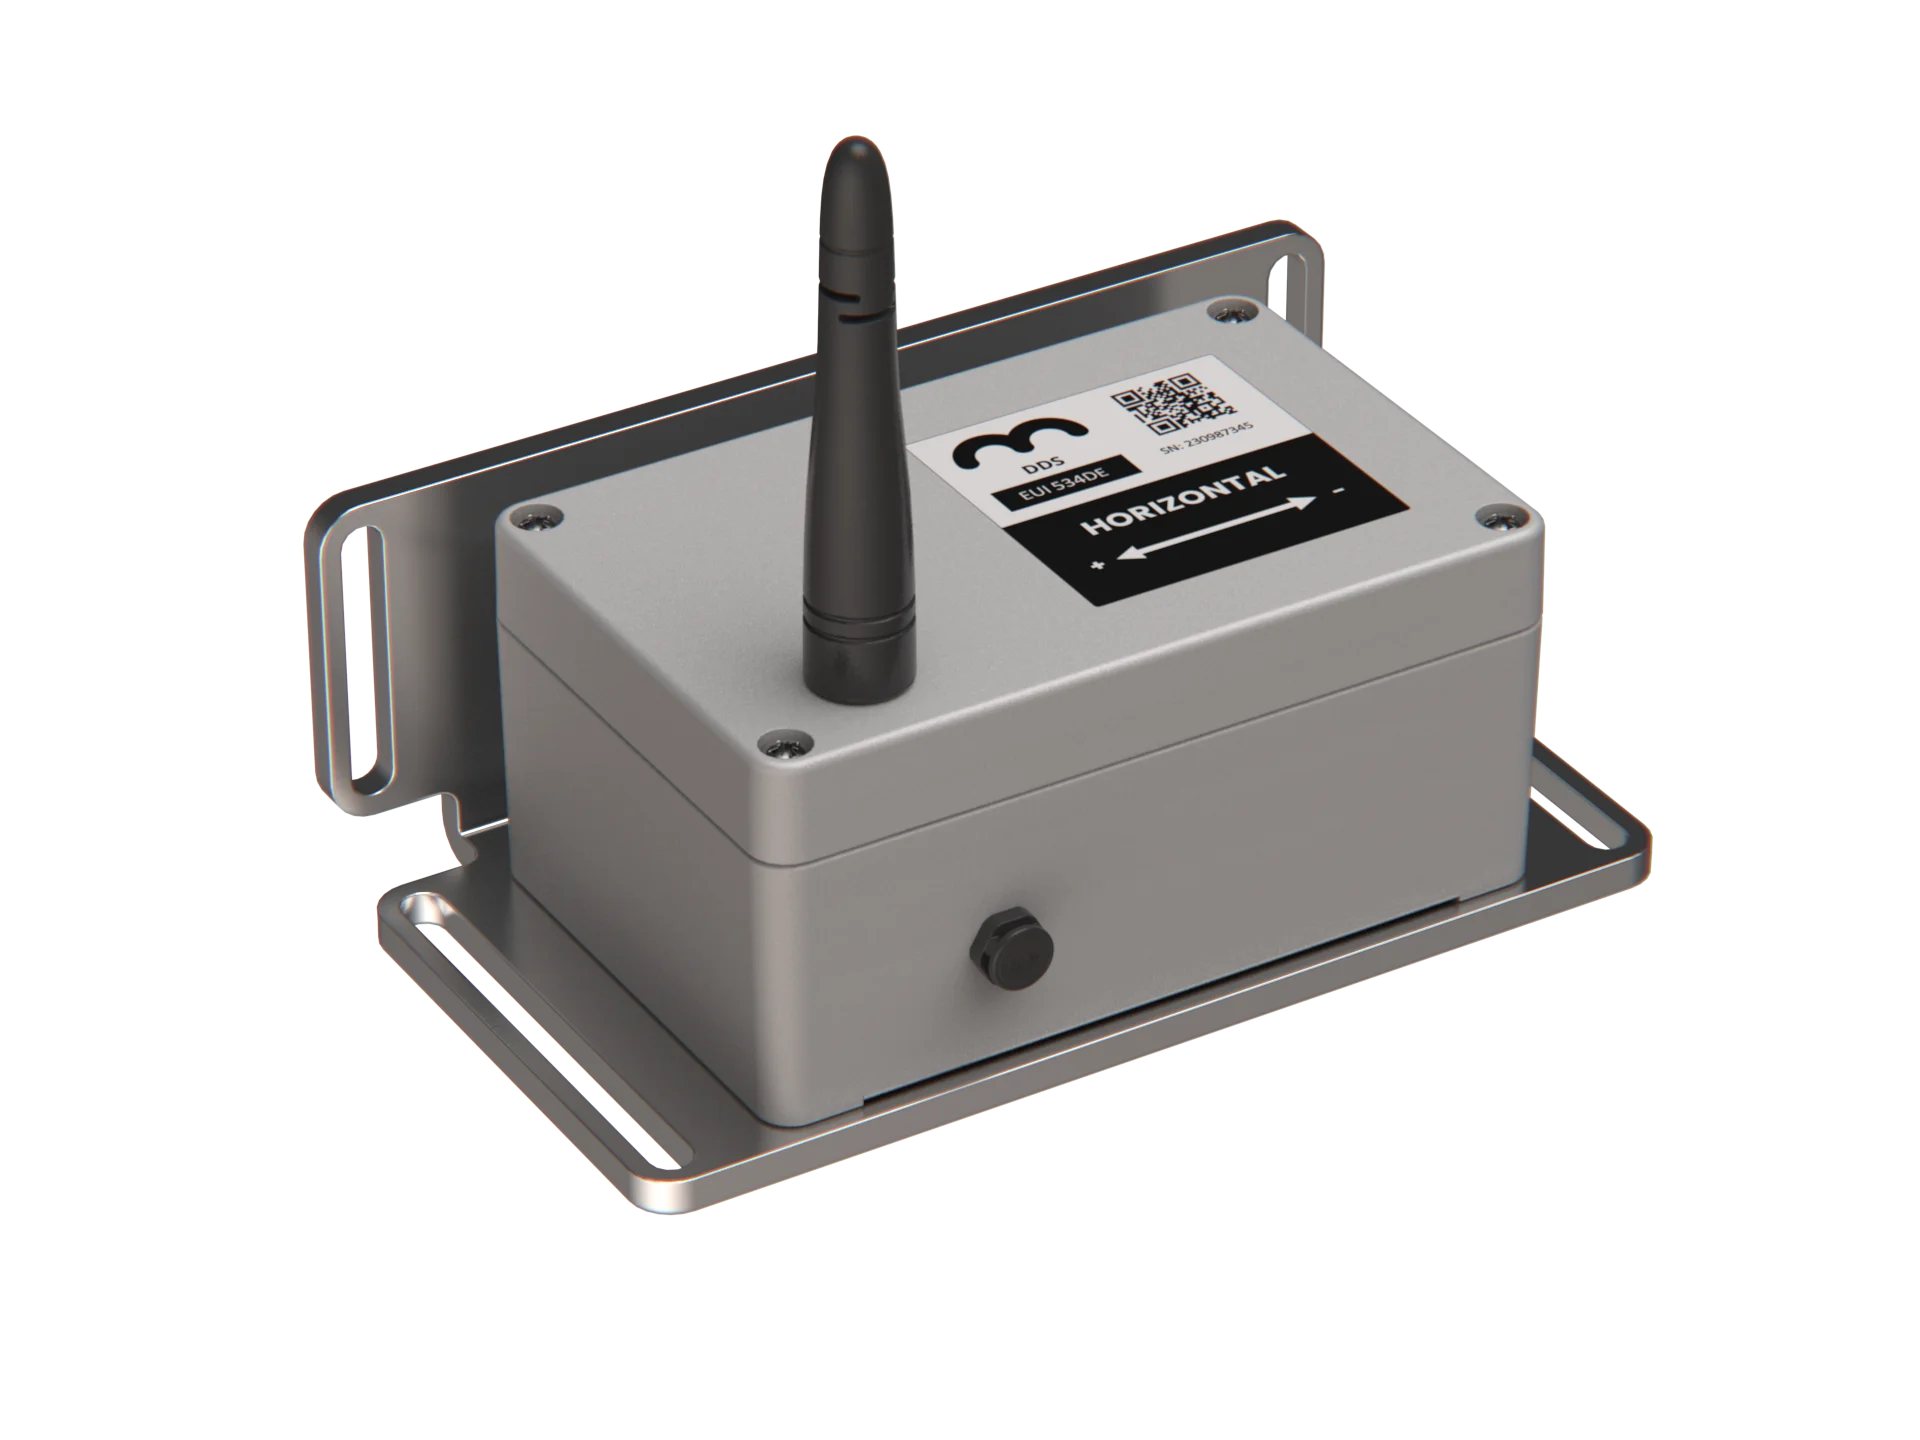
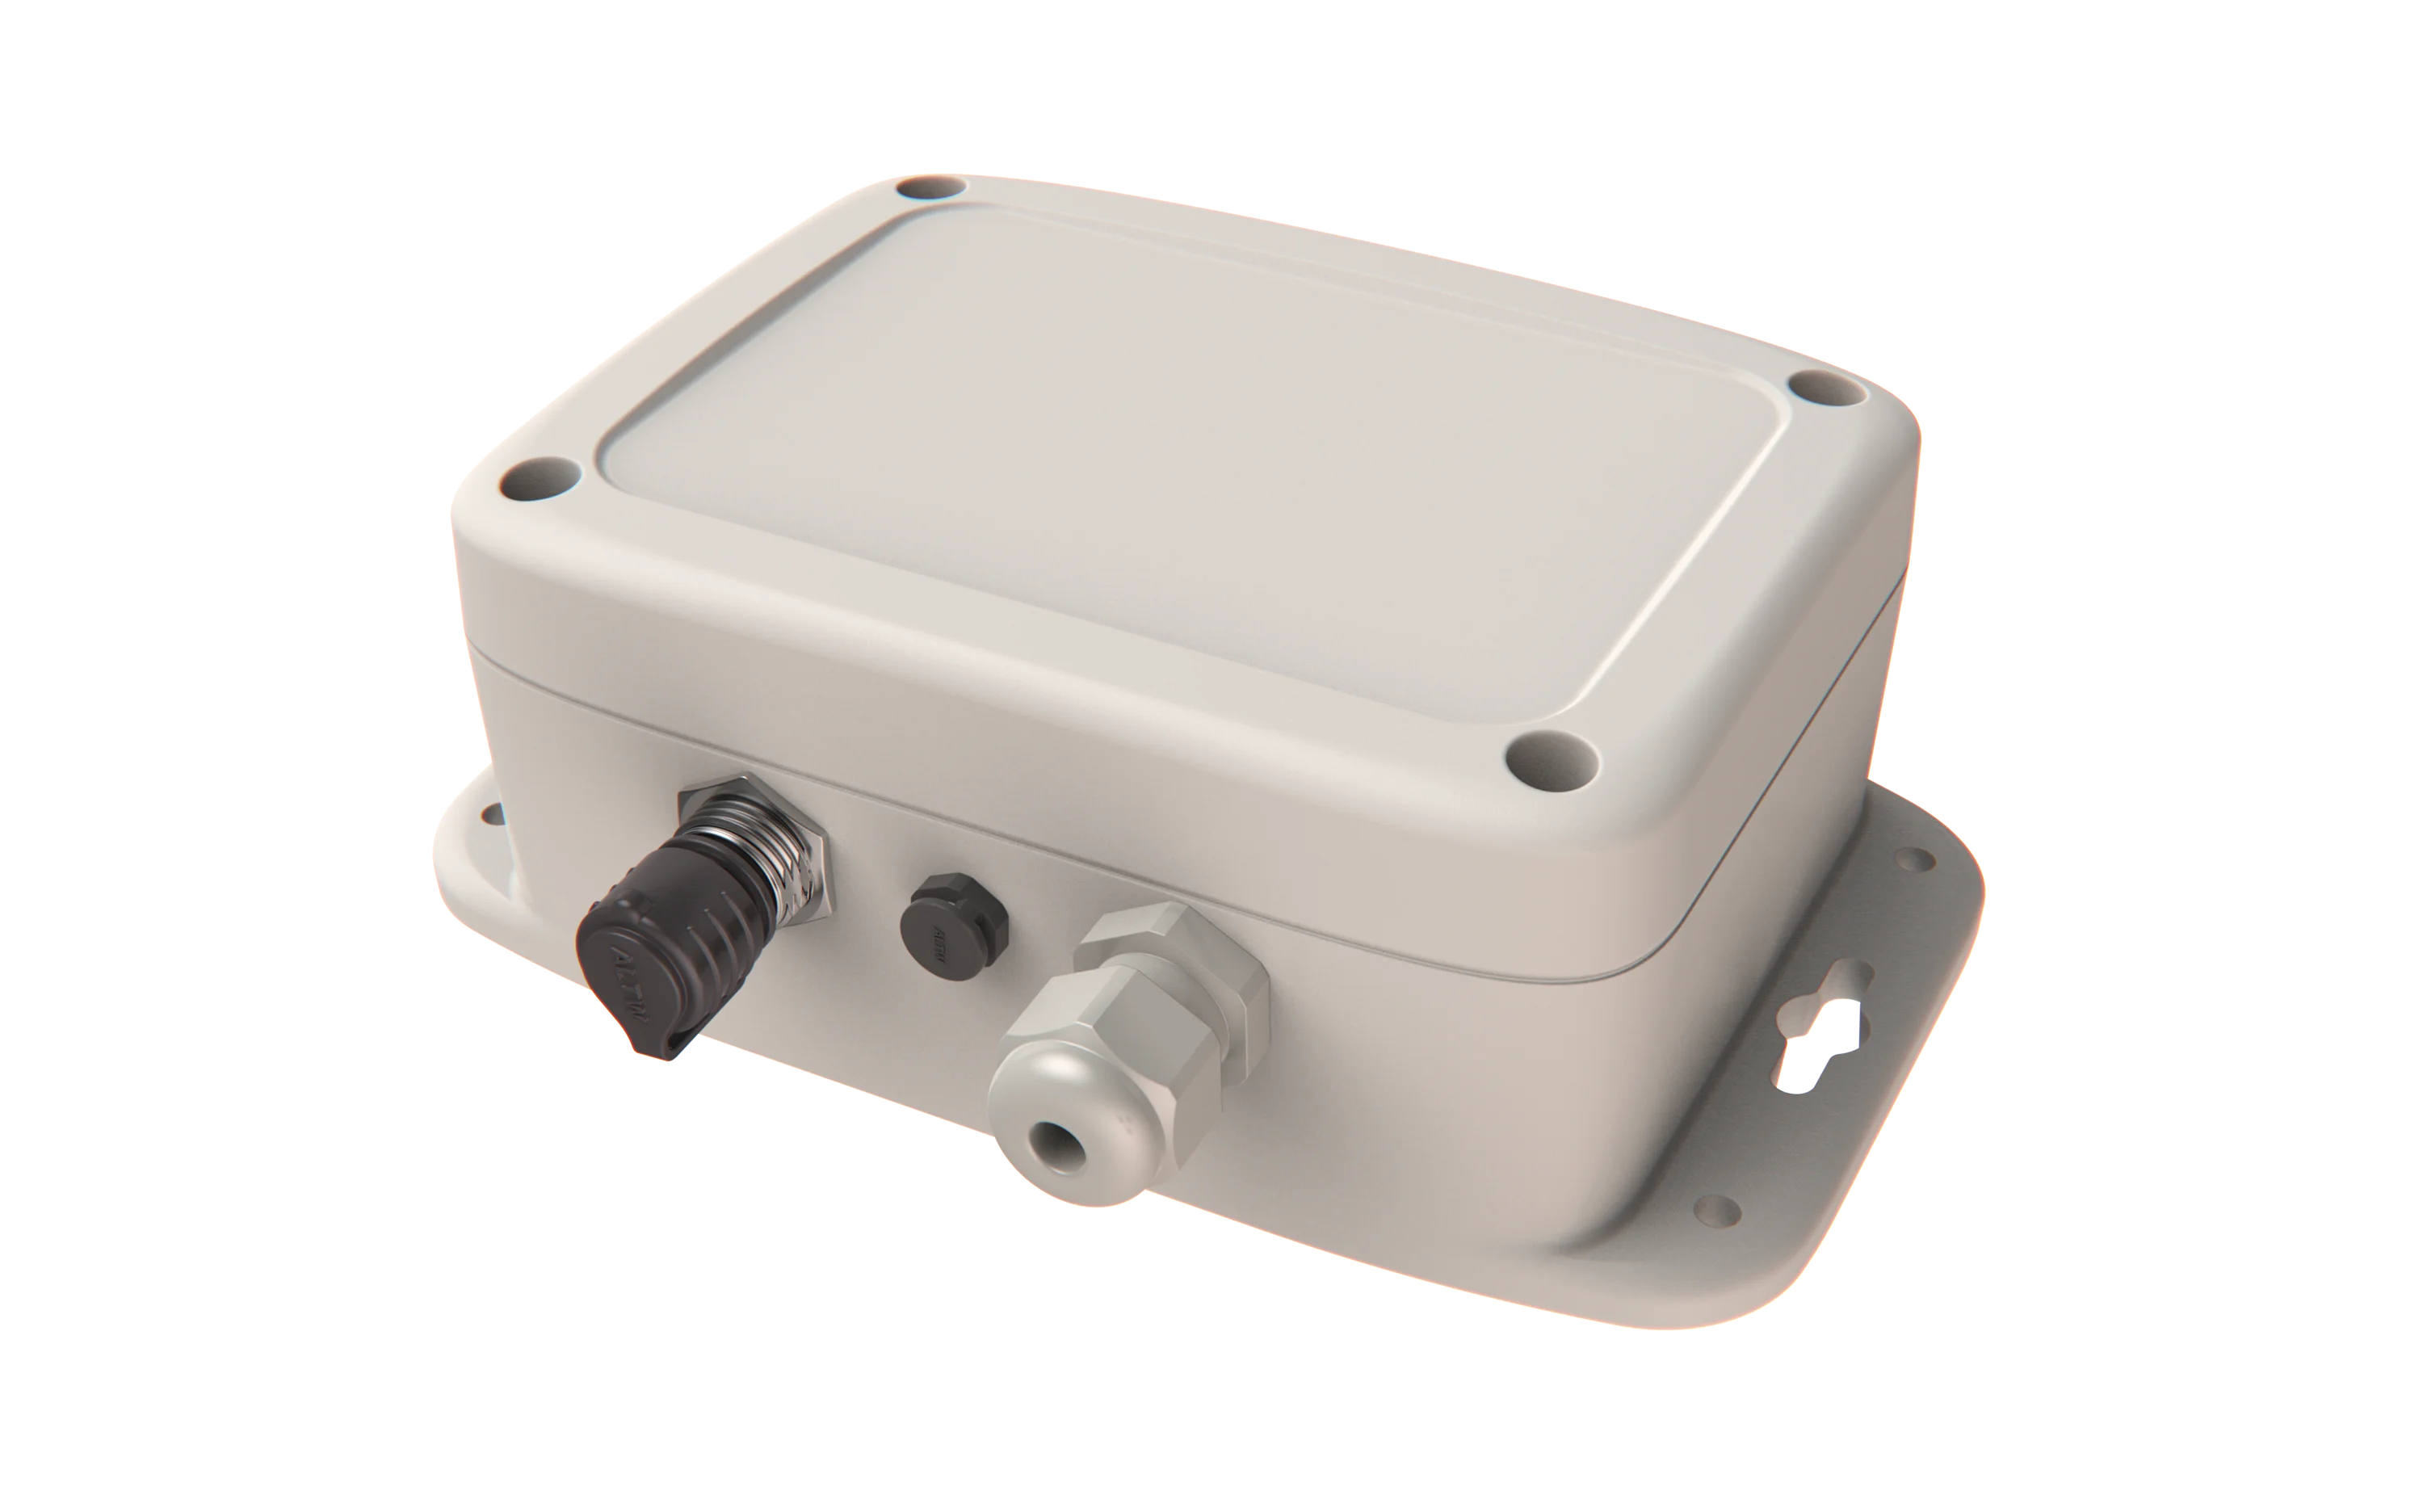
Recommended wireless sensors
Move Solutions offers high-precision, low-power sensors for structural, geotechnical, and environmental monitoring.

.webp)


The all-in-one
structural health monitoring platform
MyMove is the cloud platform that powers your structural health monitoring system.
It collects data from wireless and third-party sensors, organizes it by asset, and delivers engineering-grade insights—anytime, anywhere.
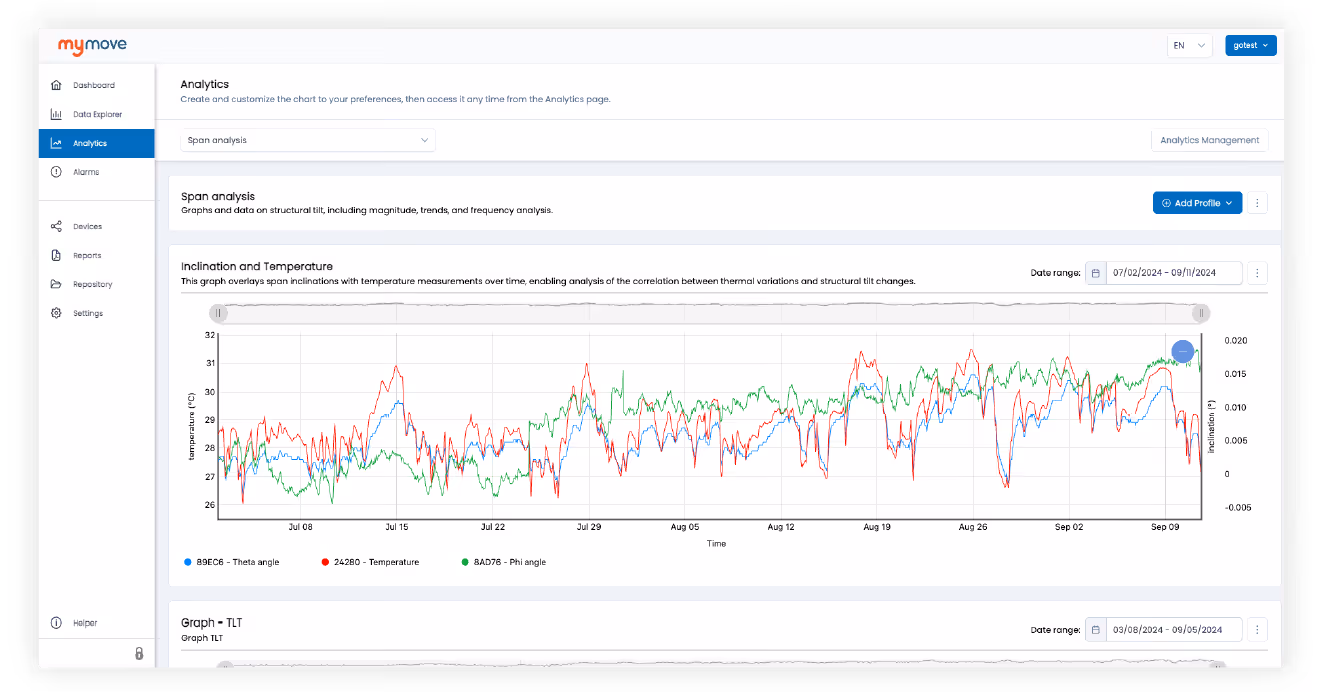
From sensor data to structural insight
Analyze time-series data, compare sensors, and uncover structural trends. MyMove turns raw measurements into insight and delivers shareable PDF reports automatically.
Create custom charts and profiles
Correlate multiples historical trends
Custom PDF templates with branding and layout
Scheduled reports for clients and authorities

Remote configuration and alarm control
MyMove enables full remote management of your structural monitoring system. Directly from the platform, engineers can configure sampling intervals, communication frequency, firmware updates, and threshold-based alarms based on real-time or derived parameters.
Sensor-level configuration of acquisition mode, frequency, triggers, and more
Definition of multi-parameter alarms and threshold conditions
Continuous diagnostics on signal strength and connectivity
Smart tools for structural health monitoring
MyMove includes built-in Advanced Tools specifically designed to simplify and optimize the monitoring of complex infrastructure applications.
No external software. No post-processing. Just clear, actionable insights.
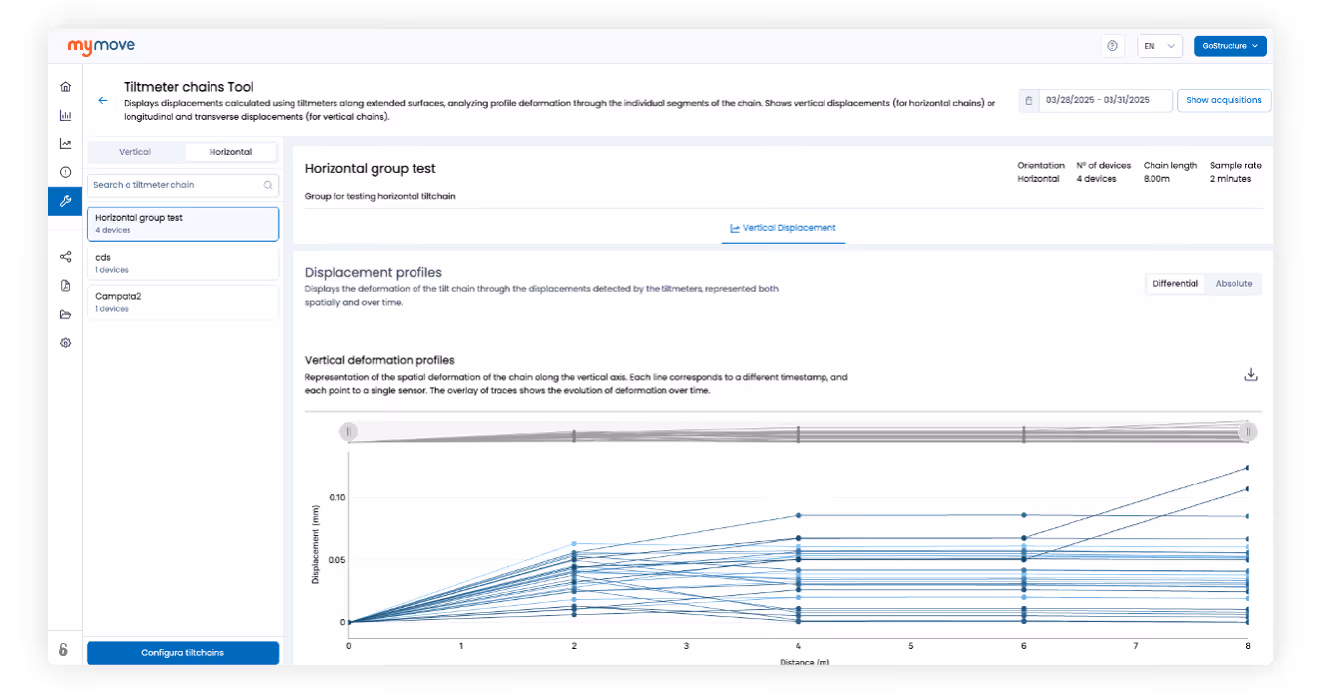
Tiltmeter Chains Tool – compute spatial displacement and deformation trendsure frequency, triggers, and more
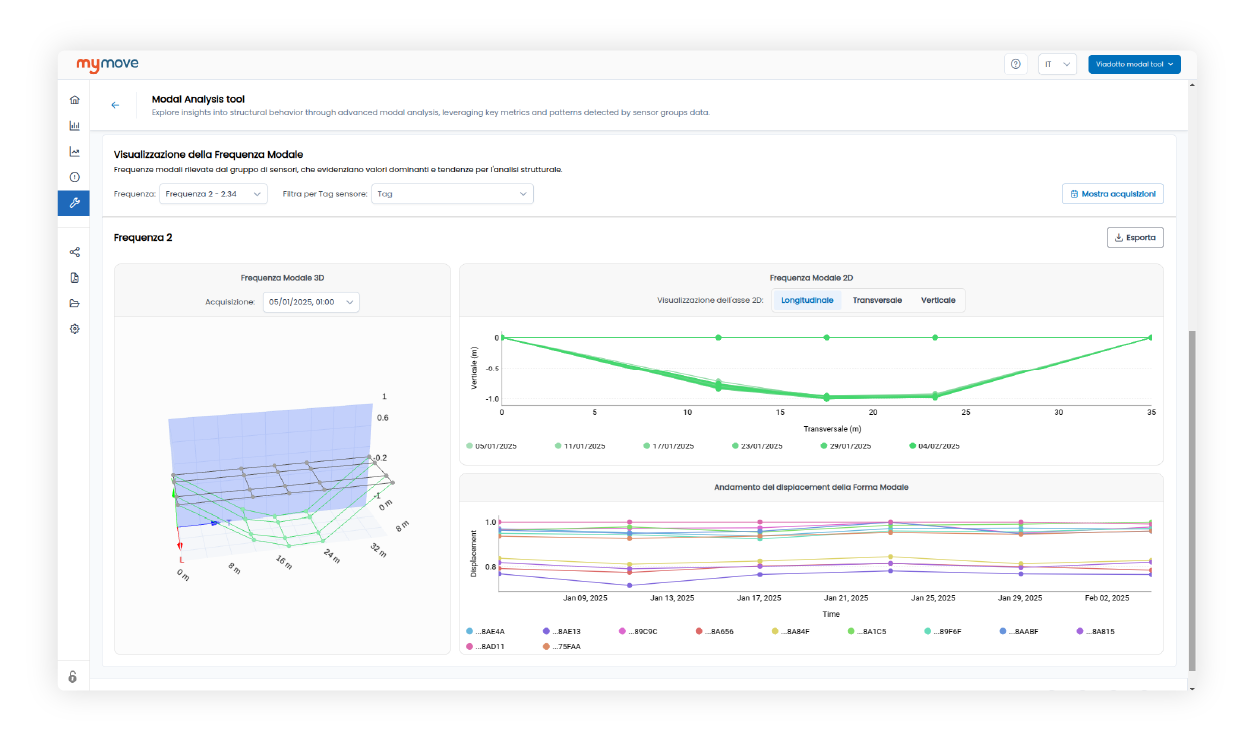
Modal Analysis Tool – identify modal frequencies, damping, and vibration modes
Rail Monitoring Tool – track cant, twist, and vertical alignment over time
Correlate long-term behavior
Full control of raw sensor data

Custom PDF reports for any stakeholder

Monitor health and connectivity

Manage devices remotely
Set multi-parameter alarms

Modal Analysis Tool
Tiltmeter Chains Tool
Bulk sensor setup & calibration

Book a live demo with our team
Discover how our platform collects data, manages your sensors remotely, and delivers structural insights—live, in one call.
Everything you need to monitor your building or monument
Get the full brochure to explore sensor configurations and monitored parameters.

Worldwide success stories
Discover how our monitoring systems are used worldwide to solve real engineering challenges across bridges, tunnels, railways, and more.
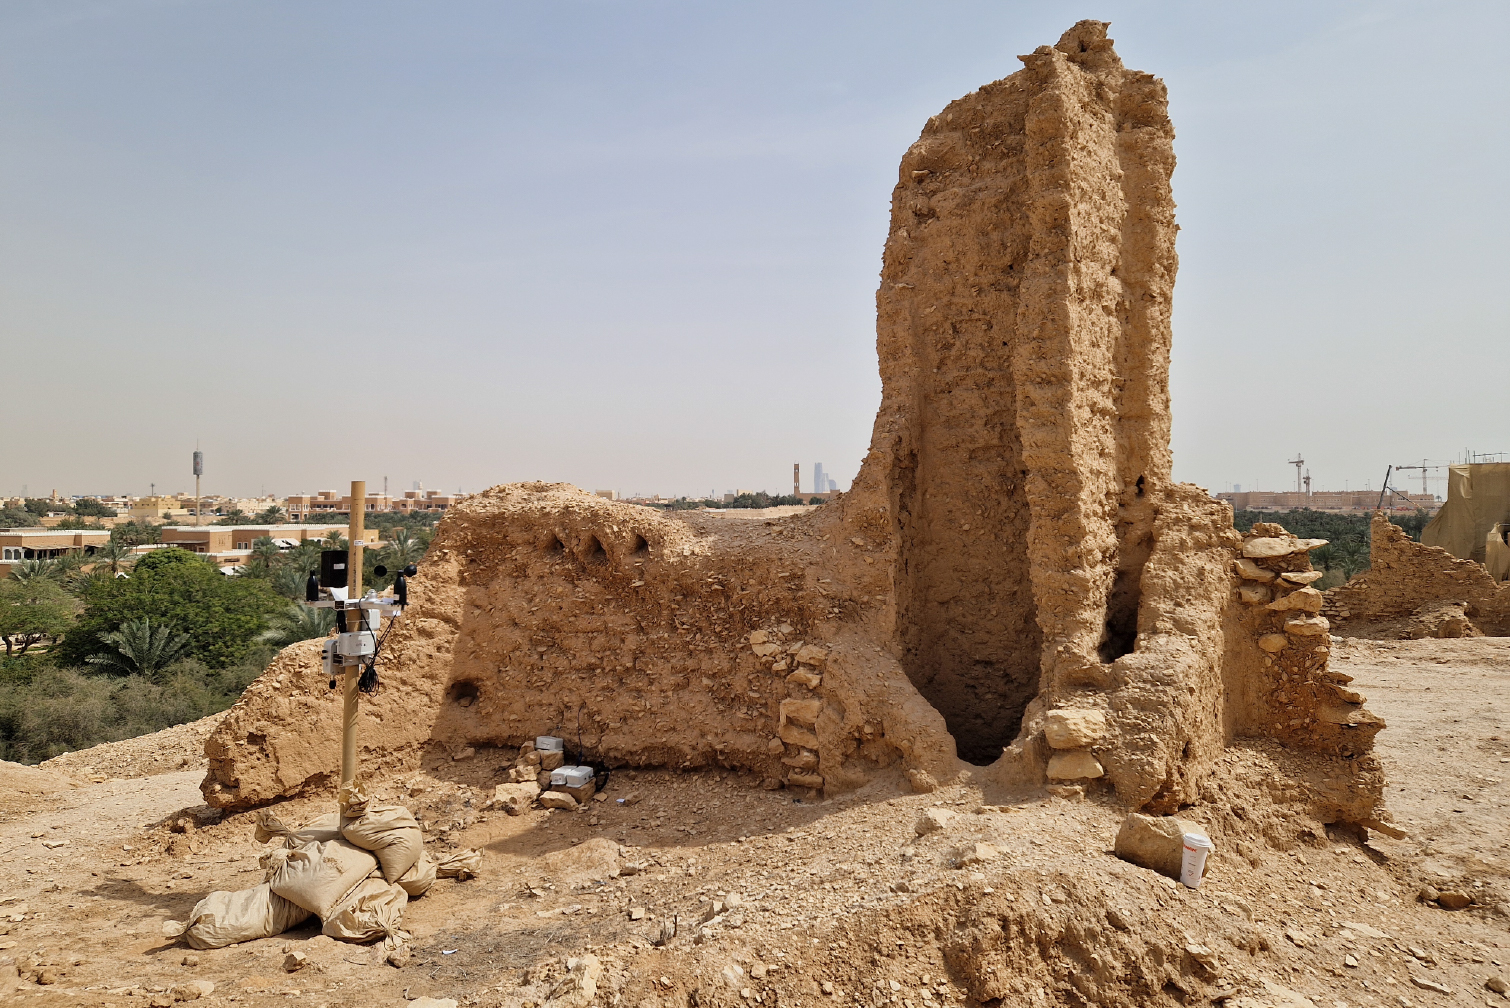
At-Turaif world heritage site – Environmental and structural monitoring for preservation
At-Turaif is the birthplace of the first Saudi state and a premier example of Najdi mud-brick architecture. Earthen walls are sensitive to moisture, temperature changes, and wind erosion. National conservation programs have stabilized and opened much of the site to visitors, increasing the need for ongoing monitoring. This campaign establishes baseline data for displacement, cracking, and environmental conditions, enabling preventive conservation and long-term risk management.
Riyadh, Saudi Arabia

Wireless Tilt Monitoring of Beirut Silos
Following the Beirut port explosion, wireless tilt sensors tracked the progressive inclination of the damaged grain silos, delivering real-time data to support safety assessments and risk management during the collapse sequence.
Lebanon, Beirut

Structural Health Monitoring of St Mark's Basilica in Venice
In order to protect St. Mark’s Basilica in Venice from high water, it was decided to build transparent glass sheets around it. Since the laying of the glass included excavations to be carried out very close to the Basilica, Digital Rilievi was chosen to monitor the two outermost columns of the façade and the two Pillars of Acre (Pilastri Acritani) placed on the right side of the Basilica, using Move Solutions sensors.
Venice, Italy
Ready to protect your building or monument?
Talk to our engineers, schedule a demo, or request a proposal.
Contact our team
newsletter
Stay updated on product releases, news, and upcoming webinars.