Rail track geometry and displacement monitoring
Track cant, twist, displacement and elevation changes in real time to detect anomalies and preserve railway integrity.

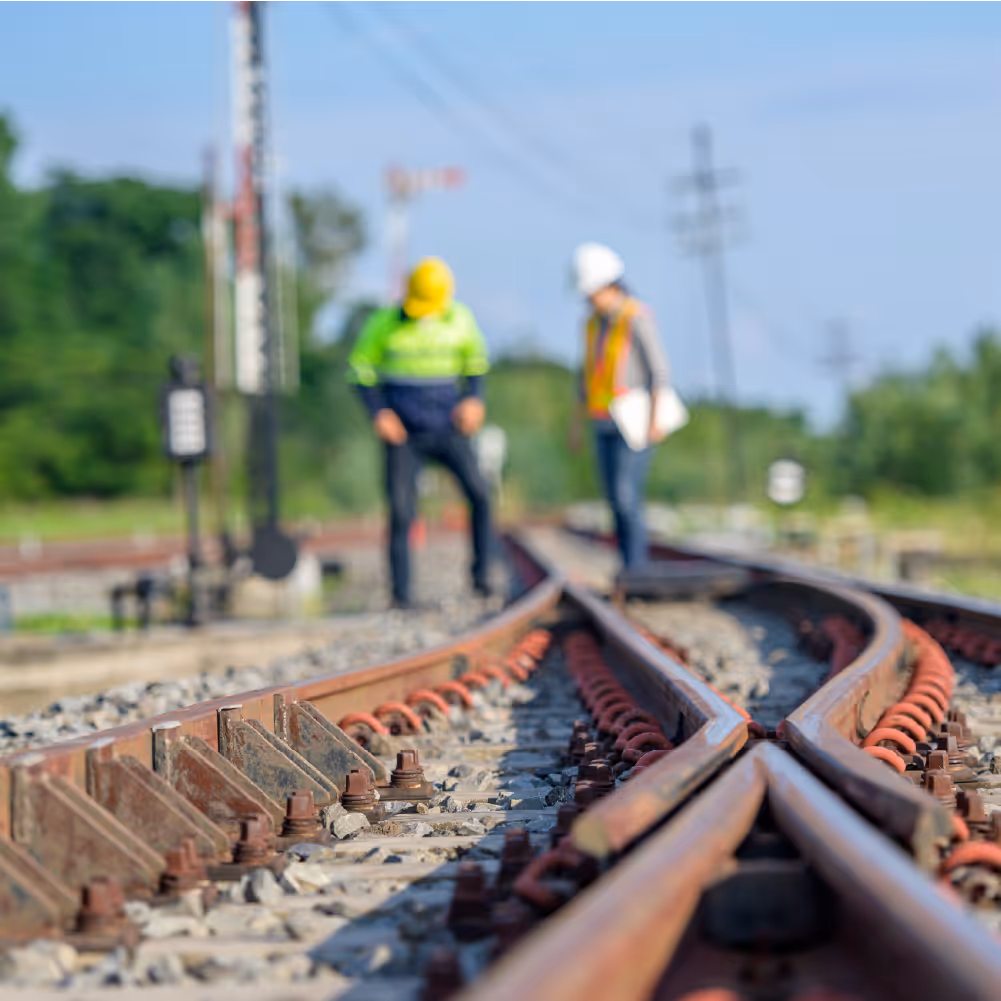
Why monitor railways?
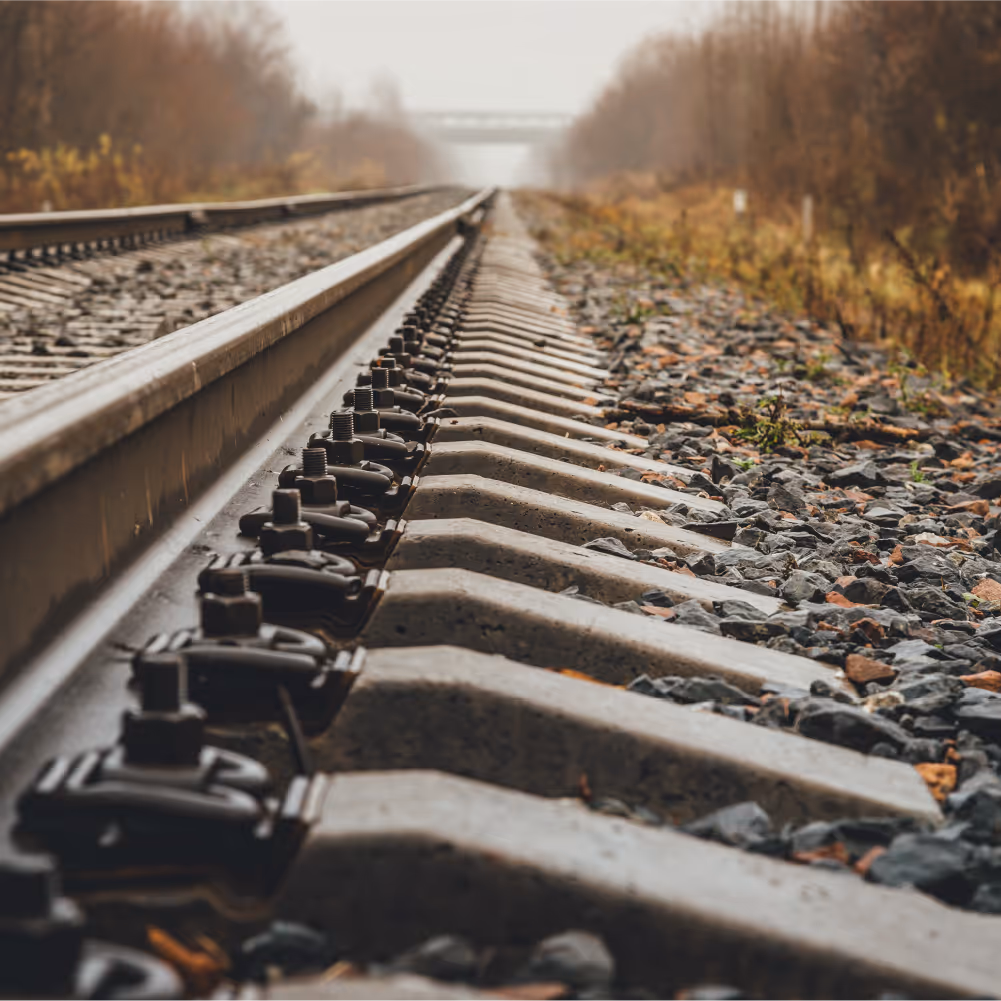
Railway tracks are subject to deformation due to ground movement, traffic loads, thermal expansion, and structural settlement. Small geometric deviations can escalate into major safety hazards, affecting operational continuity and passenger safety. Continuous monitoring of rail alignment and stability is essential to ensure long-term performance and avoid critical disruptions.
How structural monitoring system works
From sensor installation to data analysis, Move Solutions delivers a fully wireless structural health monitoring solution.
Deploy wireless devices on site. Sensors connect automatically via LoRaWAN.
Data flows to the cloud and is managed in MyMove, remotely and in real time.
Turn raw data into engineering insights with advanced built-in Tools for smart structural analysis.
Generate customized PDF reports automatically—ready to share with contractors, stakeholders, or authorities.
Why choose Move Solutions for railway monitoring
Monitor track geometry, alignment, and dynamic behavior with a wireless system designed for continuous, unattended operation. Move Solutions enables precise control of cant, twist, and vertical displacement—supporting predictive maintenance and infrastructure safety across the rail network.
Key points of structural monitoring
.avif)
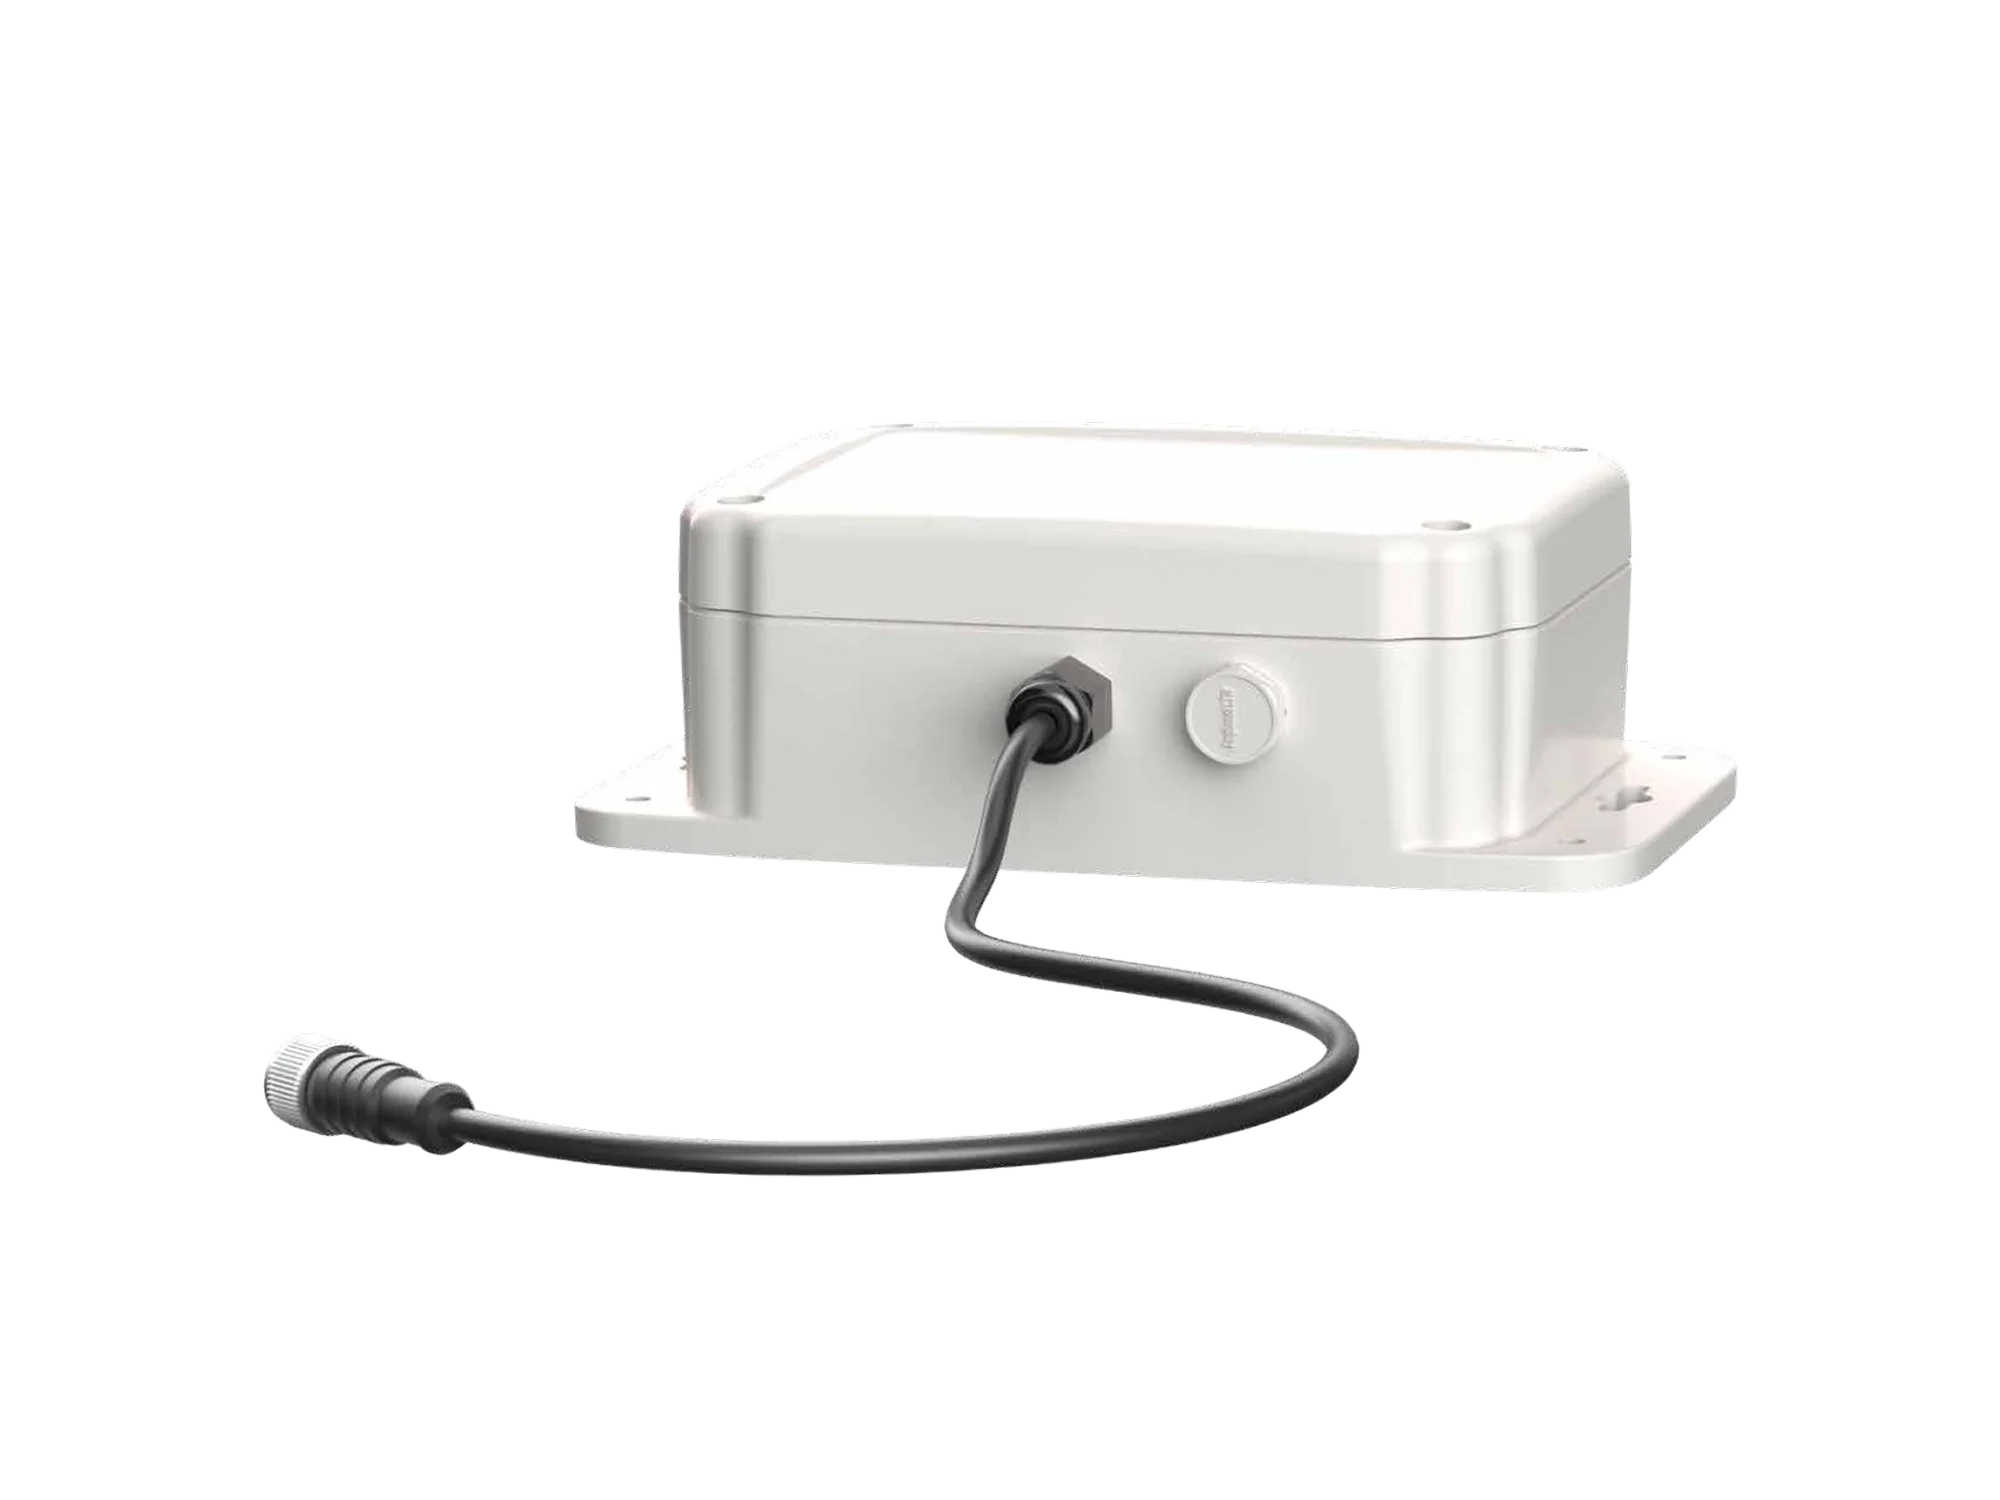
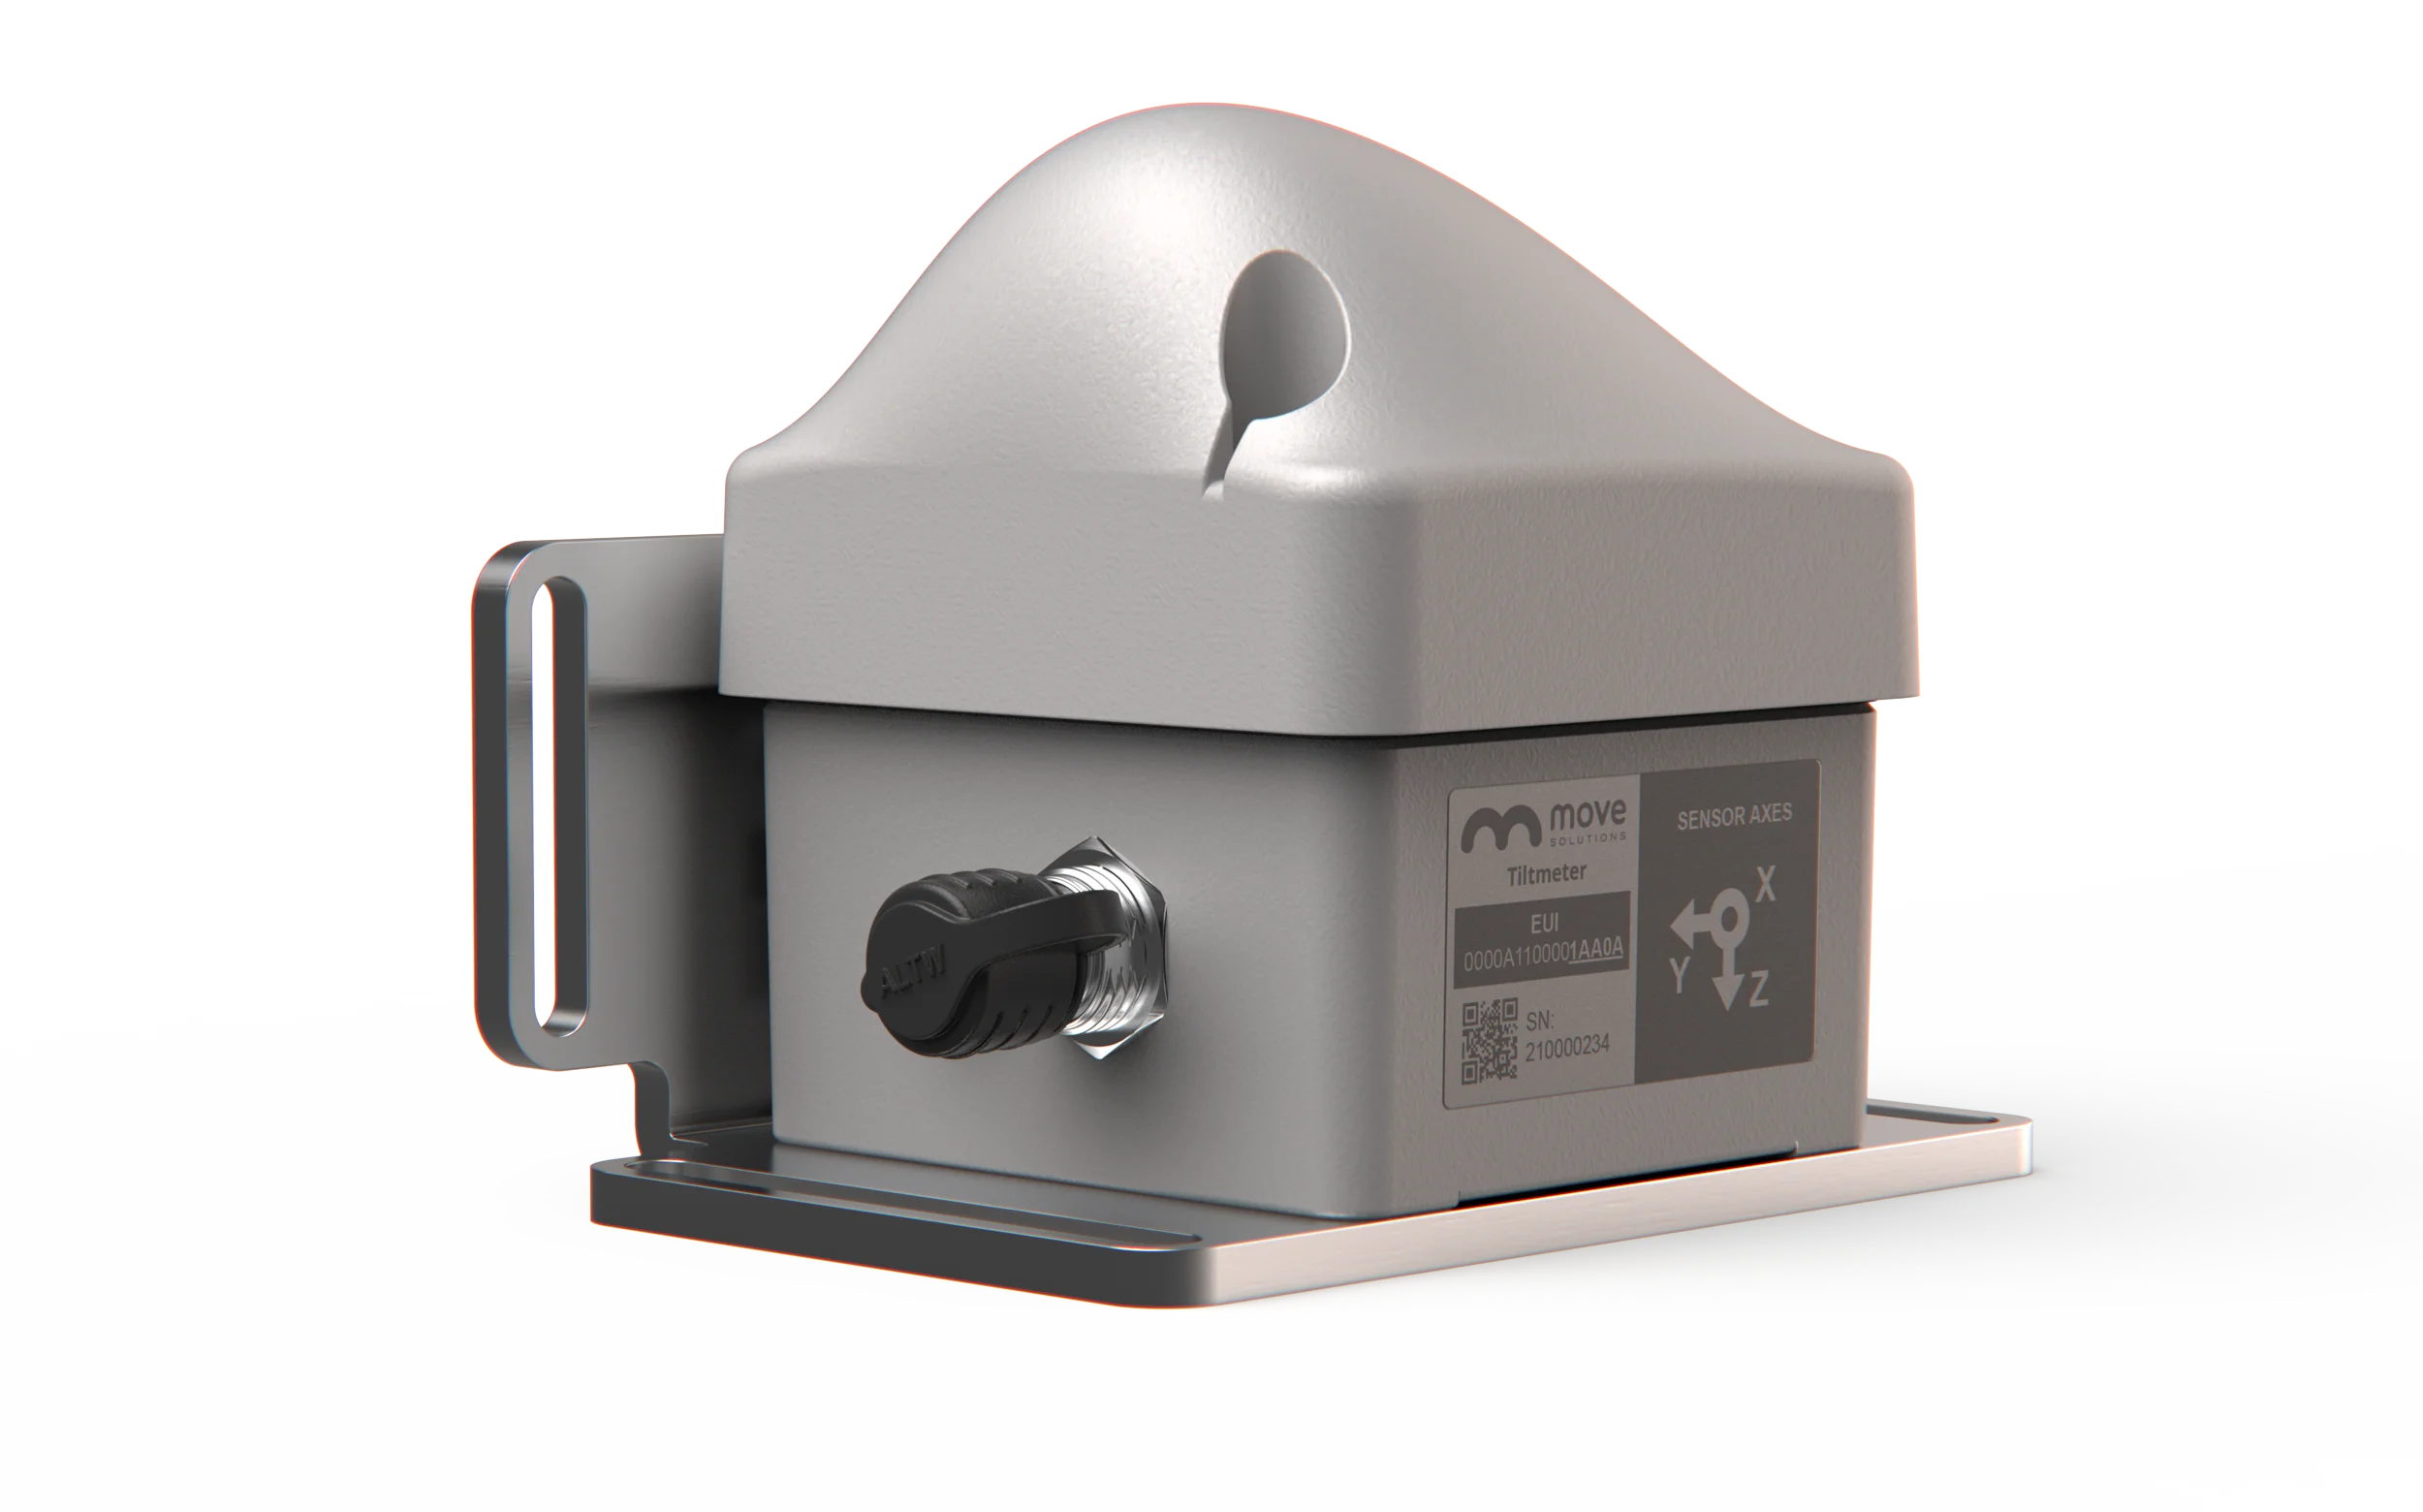
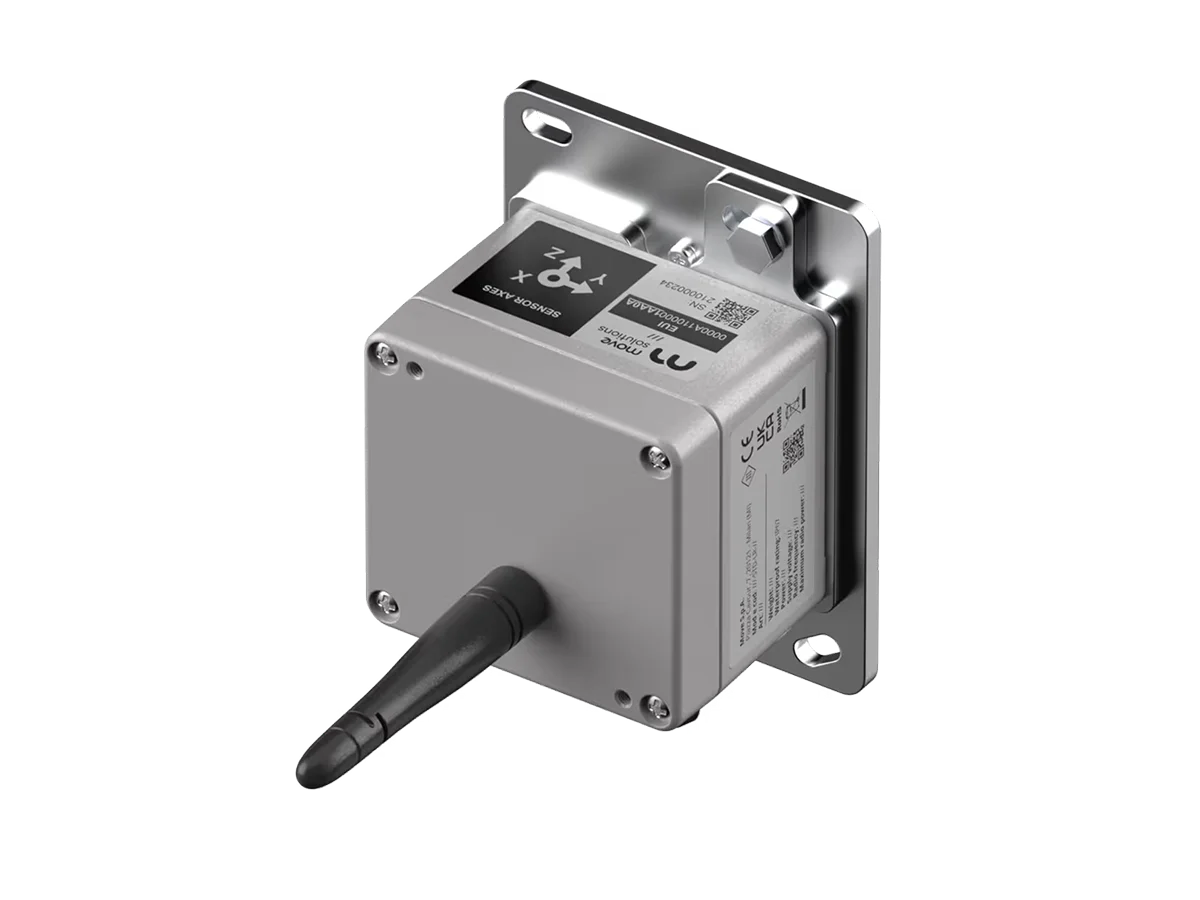
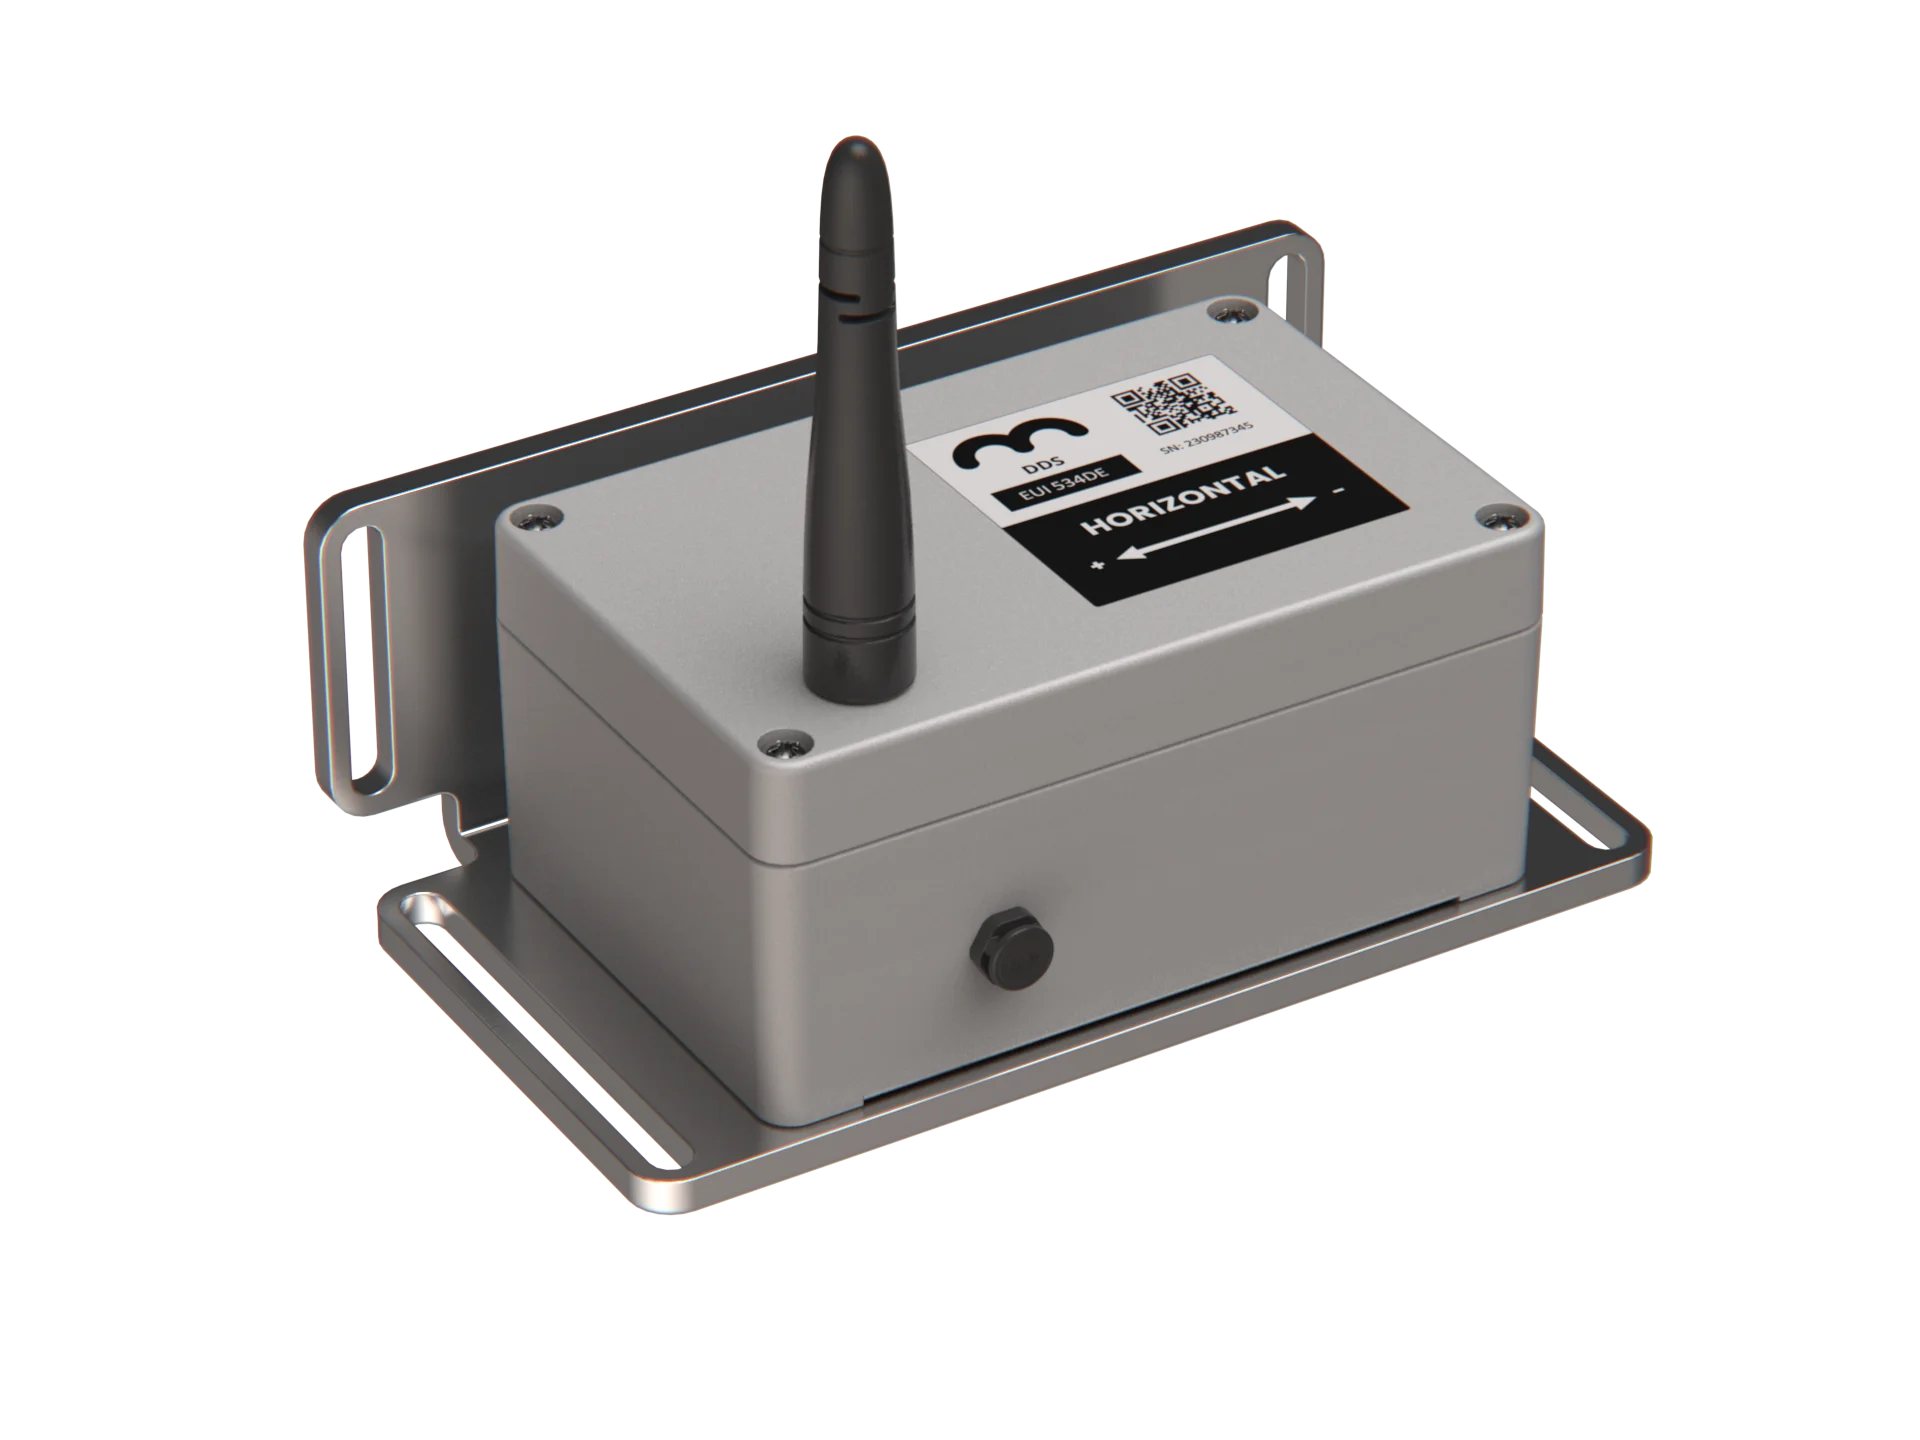
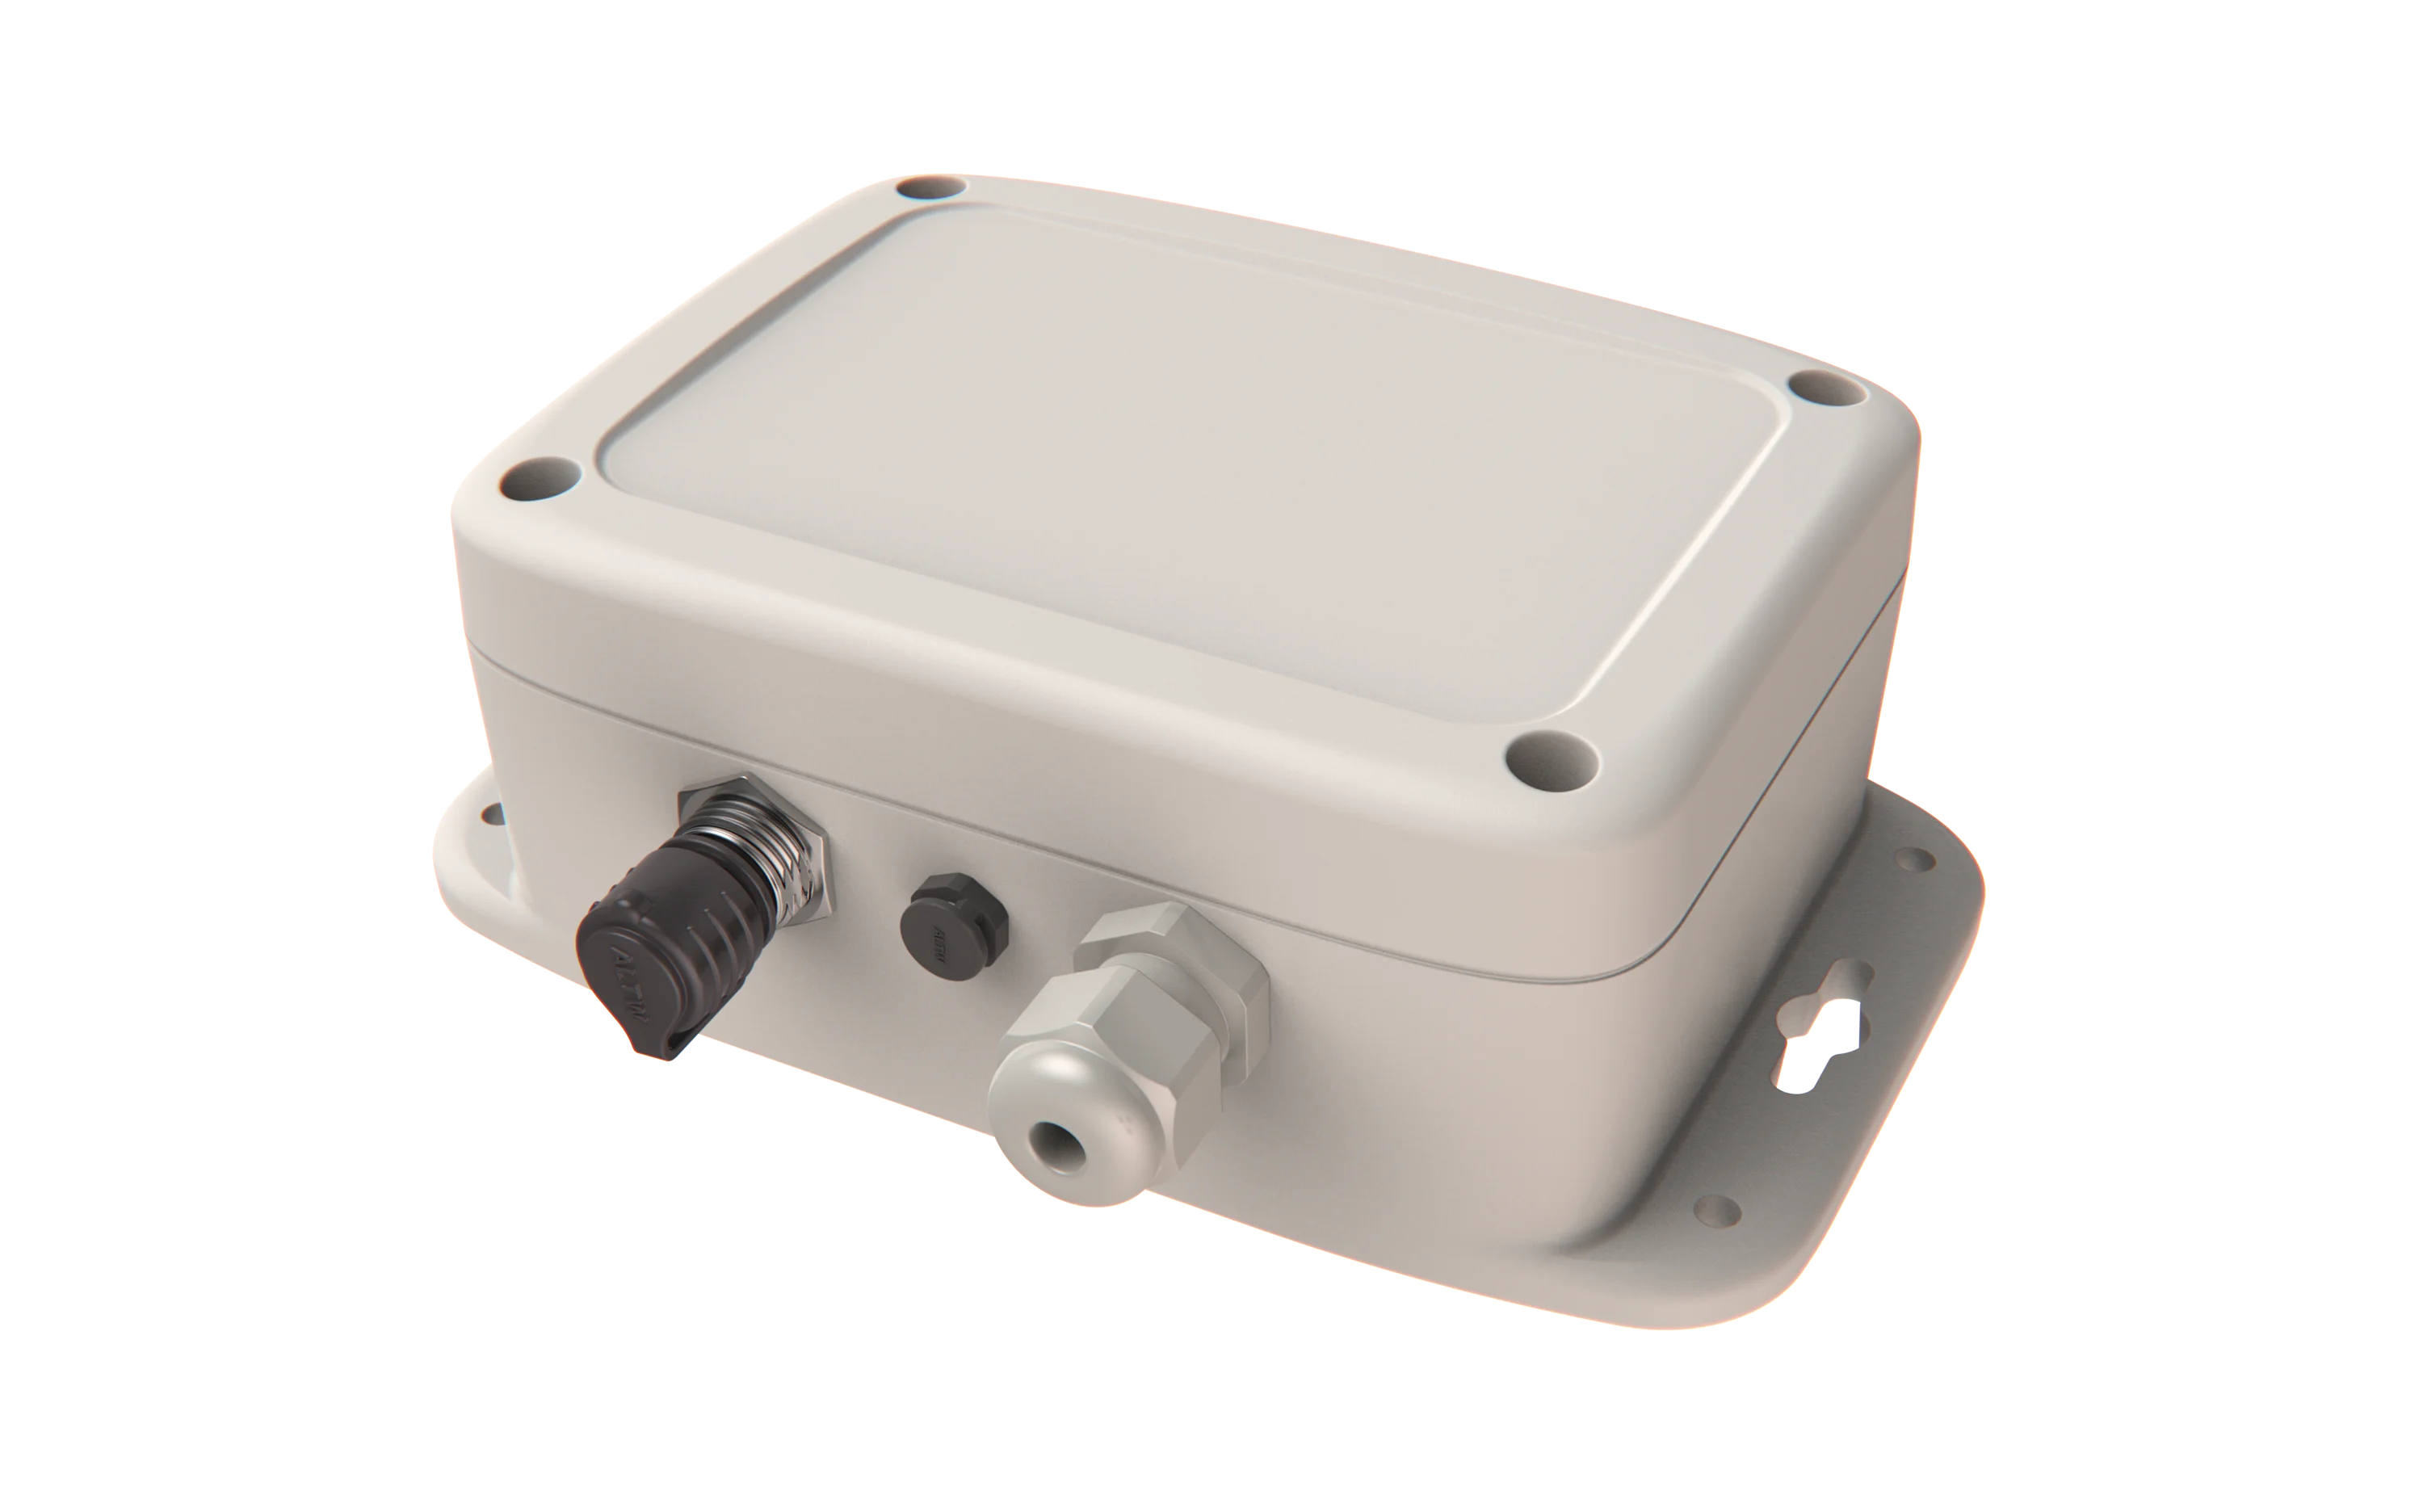
Recommended wireless sensors
Move Solutions offers high-precision, low-power sensors for structural, geotechnical, and environmental monitoring.
.webp)


The all-in-one
structural health monitoring platform
MyMove is the cloud platform that powers your structural health monitoring system.
It collects data from wireless and third-party sensors, organizes it by asset, and delivers engineering-grade insights—anytime, anywhere.
From sensor data to structural insight
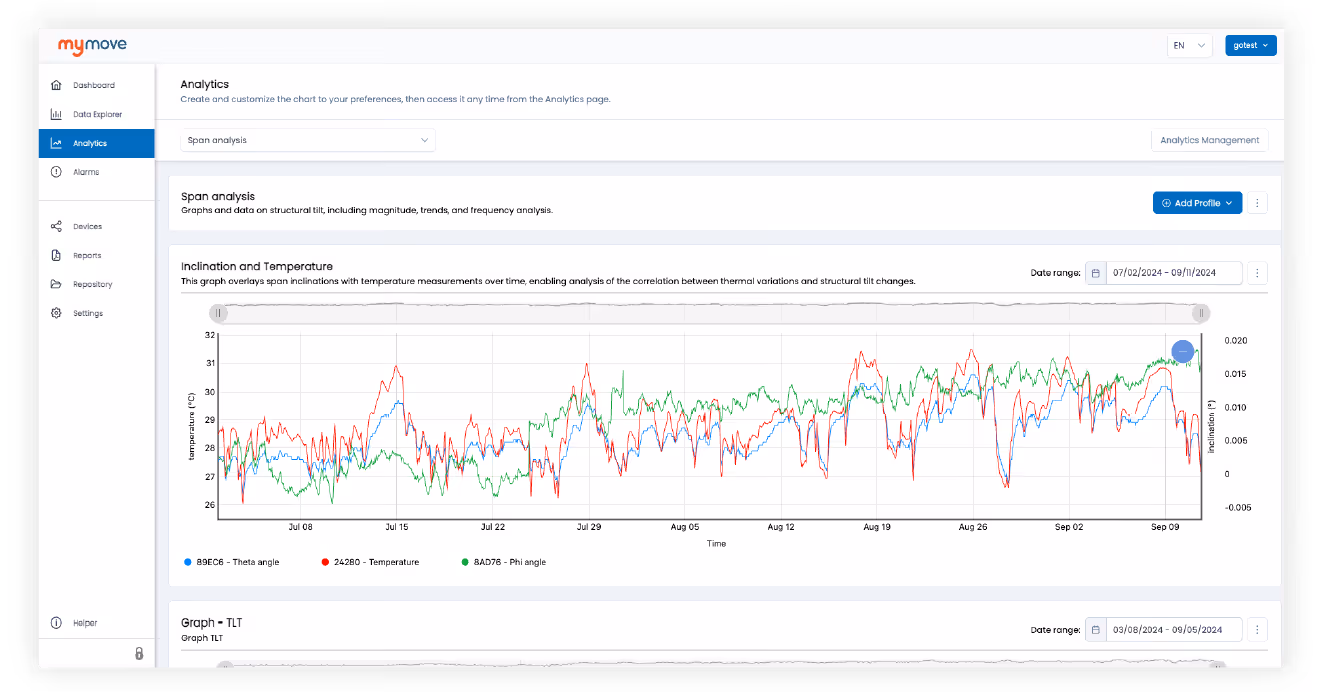
Analyze time-series data, compare sensors, and uncover structural trends. MyMove turns raw measurements into insight and delivers shareable PDF reports automatically.
Create custom charts and profiles
Correlate multiples historical trends
Custom PDF templates with branding and layout
Scheduled reports for clients and authorities

Remote configuration and alarm control
MyMove enables full remote management of your structural monitoring system. Directly from the platform, engineers can configure sampling intervals, communication frequency, firmware updates, and threshold-based alarms based on real-time or derived parameters.
Sensor-level configuration of acquisition mode, frequency, triggers, and more
Definition of multi-parameter alarms and threshold conditions
Continuous diagnostics on signal strength and connectivity
Smart tools for structural health monitoring
MyMove includes built-in Advanced Tools specifically designed to simplify and optimize the monitoring of complex infrastructure applications.
No external software. No post-processing. Just clear, actionable insights.
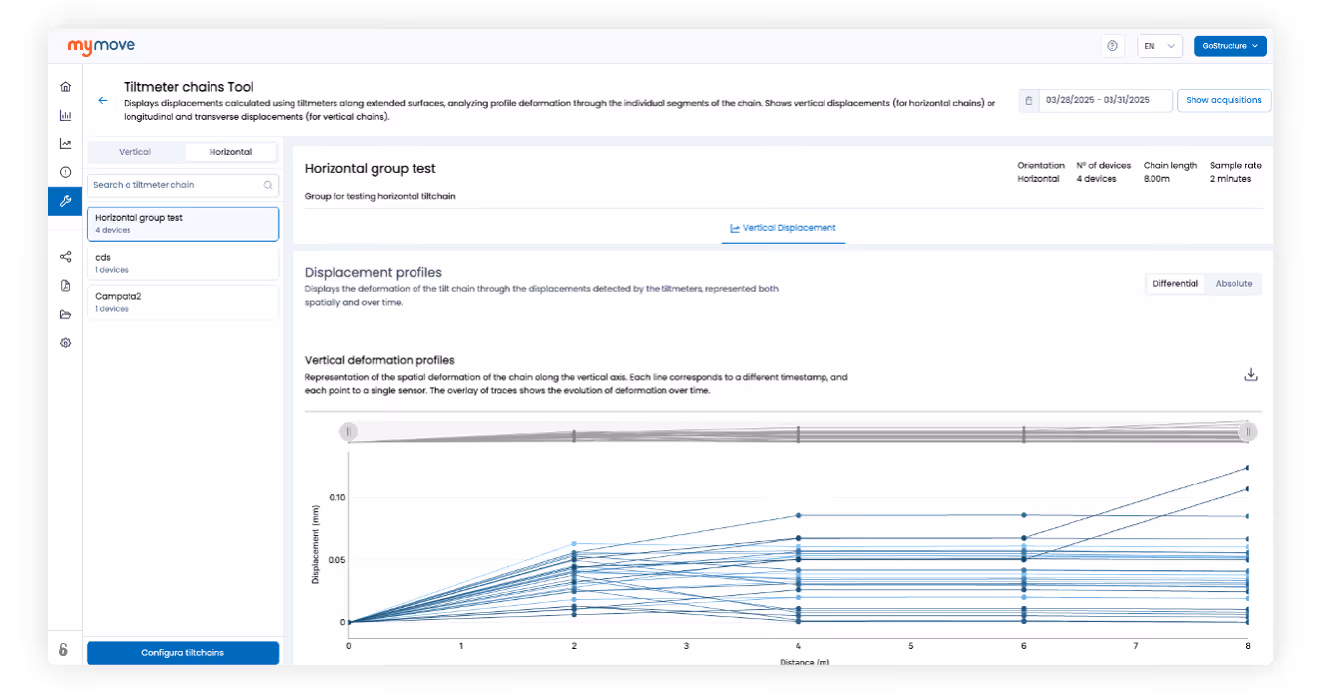
Tiltmeter Chains Tool – compute spatial displacement and deformation trendsure frequency, triggers, and more
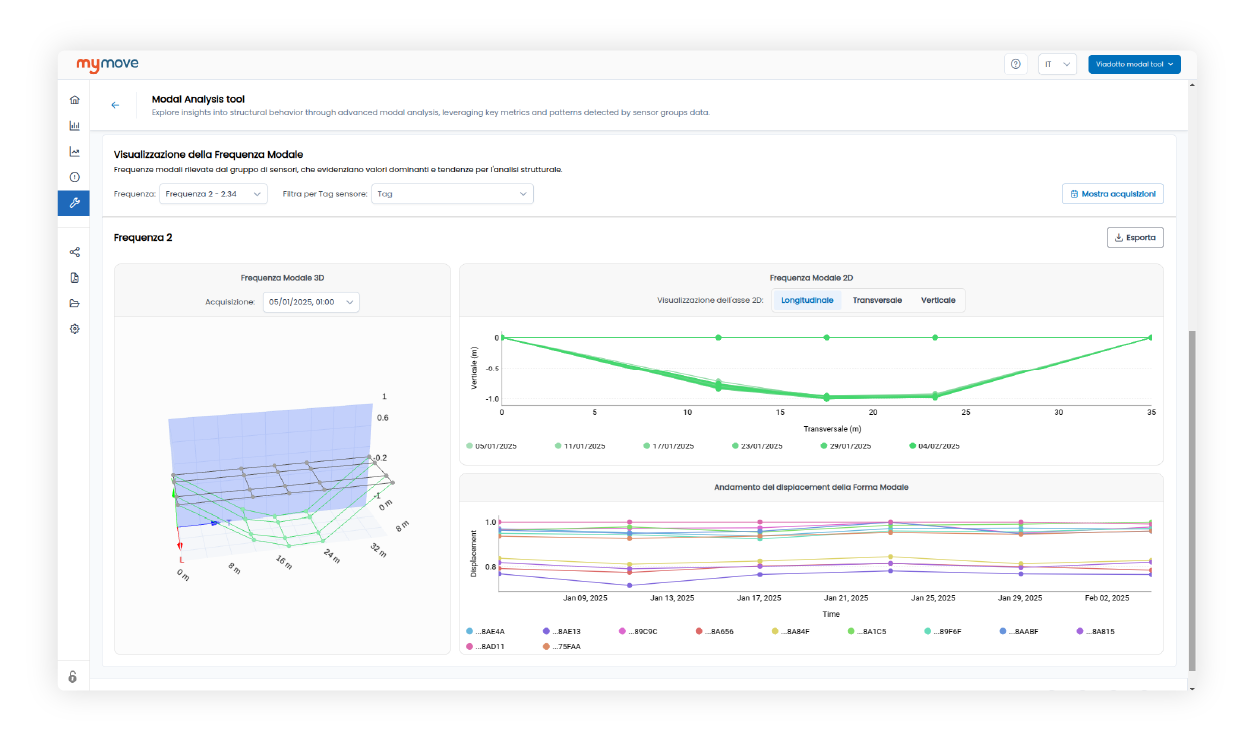
Modal Analysis Tool – identify modal frequencies, damping, and vibration modes
Rail Monitoring Tool – track cant, twist, and vertical alignment over time
Correlate long-term behavior
Full control of raw sensor data

Custom PDF reports for any stakeholder

Monitor health and connectivity

Manage devices remotely
Set multi-parameter alarms

Modal Analysis Tool
Tiltmeter Chains Tool
Bulk sensor setup & calibration

Book a live demo with our team
Discover how our platform collects data, manages your sensors remotely, and delivers structural insights—live, in one call.
Download the brochure
Everything you need to monitor your rail infrastructure.
Get the full brochure to explore sensor configurations and monitored geometry parameters
Worldwide success stories
Discover how our monitoring systems are used worldwide to solve real engineering challenges across bridges, tunnels, railways, and more.

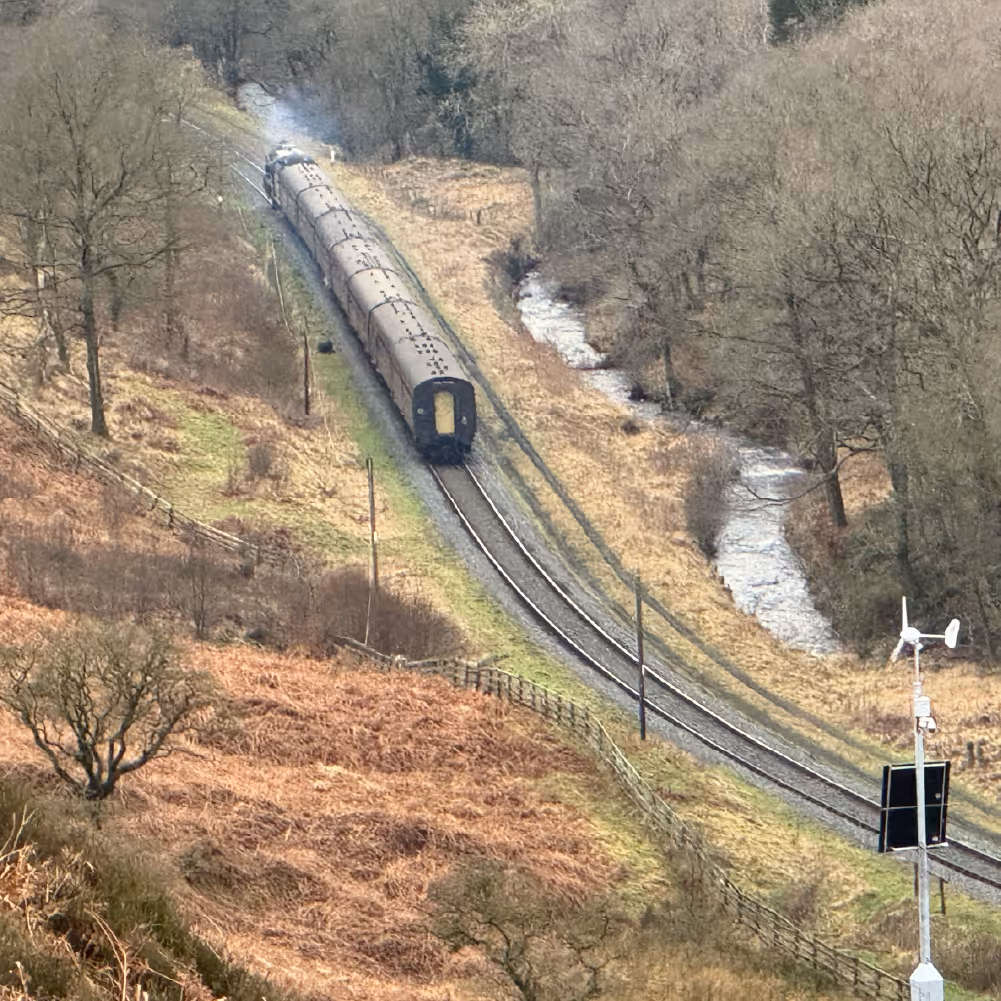
North York Moors Railway Monitoring
This project has been conducted by Academy Geomatics Ltd in collaboration with the North York Moors National Park Authority. The goal was to establish a comprehensive, real-time monitoring system to assess the behaviour of a landslip along the North Yorkshire Moors Railway, in order to ensure the safety and longevity of this crucial transportation link. Finding a suitable location for a total station proved challenging, as there wasn’t a spot that was both clear of the train tracks and had a view of the landslip. The valley offered limited stable ground for securing reference prisms. Moreover, the dense ferns and bracken, growing over a meter tall during summer, posed a risk of blocking the line of sight.
North Yorkshire, UK

Rail Viaduct Real-Time & Long-Term Monitoring
This case study is a pioneering project led by Professor Hannes Grabe, Head of the Department and Chair of Railway Engineering at the University of Pretoria. The article showcases the application of Move Solutions’ advanced technology for the real-time and long-term monitoring of a railway viaduct in Pretoria, South Africa.The railway sector in South Africa is on the cusp of a transformative era, with Transnet objectives and government investments bolstering its development. The University of Pretoria, in collaboration with key industry stakeholders, is pioneering Railway Engineering advancements in Africa.
Pretoria, South Africa
Ready to monitor your railways?
Talk to our engineers, schedule a demo, or request a proposal.
Contact our team
newsletter
Stay updated on product releases, news, and upcoming webinars.