Bridge Vibration Monitoring: Methods, Sensors, and Real-Time Alerts

Join the Move Solutions newsletter
Stay updated on product releases, news, and upcoming webinars.
More than 42,000 of the 617,000 bridges in the United States are classified as structurally deficient (ASCE 2021 Infrastructure Report Card). Europe looks similar, and the recent collapses of the Morandi Bridge in Genoa (2018) and the Fern Hollow Bridge in Pittsburgh (2022) shared the same root cause. In both cases, biennial visual inspections did not catch the critical degradation in time. Continuous vibration monitoring is what closes that gap, by tracking the modal frequencies and Peak Particle Velocity of the bridge between one inspection and the next.
Why Bridge Vibration Is the Most Diagnostic Health Signal
Bridge fatigue does not announce itself. Cracks form internally before they reach the surface, foundation settlement progresses by millimetres over months, and a corroding tie plate can look fine in a photograph until most of the section is gone. All of these changes show up in the bridge's dynamic fingerprint (its natural frequencies, mode shapes and damping ratios) earlier than they show up in any inspection report. These parameters are global indicators of stiffness, and when this stiffness decreases the natural frequencies of the structure drop. Tracking that drop over time is the basis of vibration-based SHM.
The Fern Hollow collapse in Pittsburgh is the textbook example of why this matters. A transverse tie plate had been losing section to corrosion for years, and the stiffness loss it produced would have shown up as a measurable modal frequency drift long before the bridge actually fell.
Bridge Vibration Monitoring Methods, From Ambient Analysis to Operational Modal Analysis
Operational Modal Analysis (OMA), the industry standard for in-service bridges
Operational Modal Analysis, often shortened to OMA, is the most widely adopted methodology for in-service bridge monitoring. It is an output-only method, which means it relies on the vibrations that the bridge already experiences in normal operating conditions. Since traffic, wind and surrounding ambient activity supply enough excitation, there is no need to shut down the bridge or install a vibrodyne. Within OMA, the three techniques used most often in practice are peak-picking, Frequency Domain Decomposition (FDD) and Stochastic Subspace Identification (SSI). Of these, FDD is the most common in commercial deployments because it offers a good balance between accuracy and computational cost.
Forced excitation testing, when it still makes sense
Forced excitation still has a role, but it is now mostly limited to specific use cases like commissioning of newly built bridges, post-strengthening load tests, or research applications. The reason it is no longer the default for routine monitoring is that it requires heavy equipment, the bridge has to be closed to traffic, and the cost is high compared with the diagnostic value it provides on an existing structure.
Crowdsensing and emerging methods
A more recent line of research uses sensors mounted on cars, or even the accelerometers already present in the smartphones of users who drive across a bridge. From this aggregate data, the natural frequencies of the structure can be identified without installing a dedicated sensor network. The first real-life experiment of this approach was carried out in 2018, on a bridge instrumented with a smartphone attached to a car dashboard over 42 trips. It is a promising direction, but it is not yet production-grade for asset management.
The 4 Sensor Types Used in Bridge Vibration Monitoring
1. Accelerometers, the workhorses of vibration SHM
Accelerometers measure modal frequencies and mode shapes, and they are the most common type of sensor in any bridge vibration program. Within this category, you will encounter two families when specifying a system.
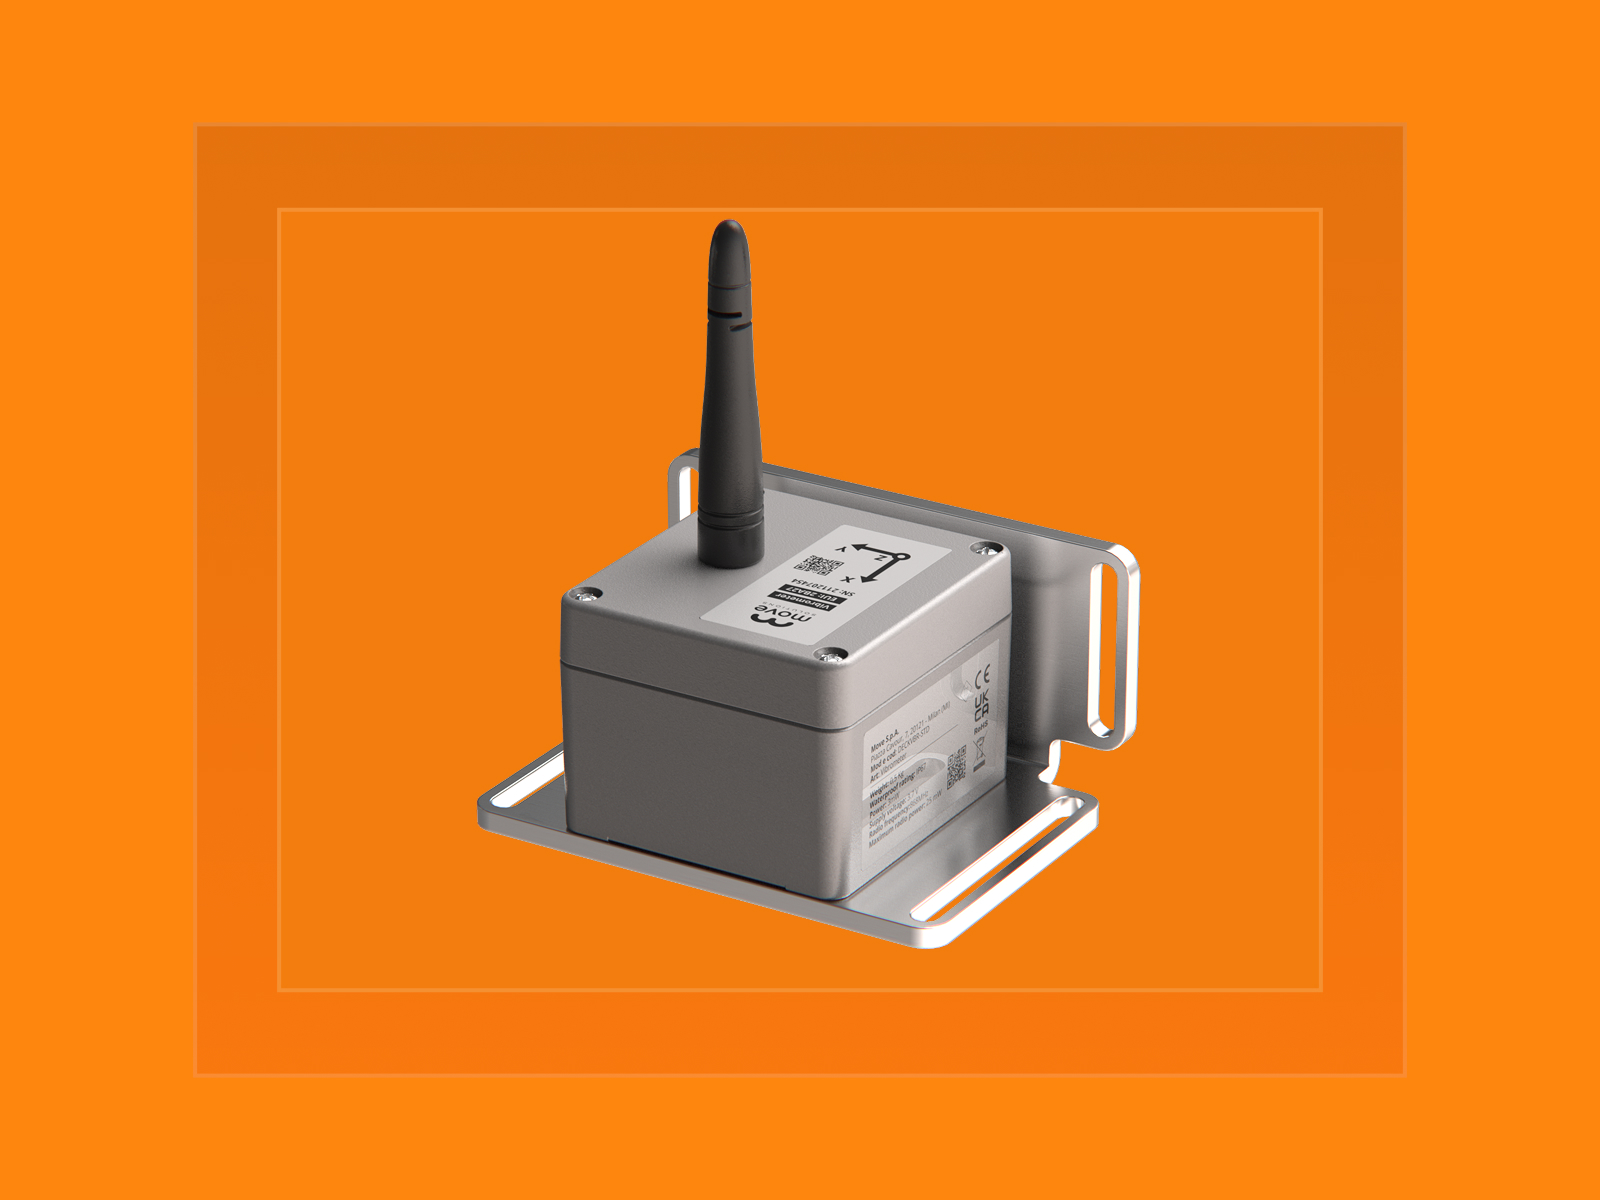
One family is the MEMS accelerometer, based on silicon micro-electromechanical systems. It is low-cost and low-power, and it works well with wireless deployments. When the sampling cadence is configured properly, a MEMS accelerometer designed for SHM can run on a single lithium battery for more than five years. This battery life makes MEMS the natural choice for long-term continuous monitoring on bridges that are difficult to access. The Move Solutions DECKAXE-SHM Accelerometer is a MEMS triaxial device designed for this exact use case.
The other family is the piezoelectric accelerometer. It offers higher precision and a wider frequency range, but it is cabled, expensive, and it consumes more power. Its use today is mostly limited to research, structural testing, or critical infrastructure where a cabled backbone already exists.
2. Vibrometers, when you need particle velocity instead of acceleration
A vibrometer measures the Peak Particle Velocity (PPV) of the structure in millimetres per second along three orthogonal axes. This parameter is the one required by most international vibration standards, including DIN 4150-3, UNI 9916 and BS 7385. So if your monitoring program needs to demonstrate compliance with one of these standards, or if you need to assess vibrations induced by adjacent construction works, heavy traffic, train passages or controlled blasting, a vibrometer is the right choice. The Move Solutions DECKVBR-STD Vibrometer is a triaxial MEMS device with a resolution of 0.003 mm/s and a range of ±100 mm/s.
3. Displacement sensors and tiltmeters, the complementary layer
A vibration-only program covers the dynamic behaviour of the bridge, but it does not cover the static deformation. To get this full picture, you need to add tiltmeters that measure angular rotation of piers and abutments, together with displacement sensors that capture the sag profile of the deck under thermal or traffic load. These devices do not replace accelerometers or vibrometers, but they make the diagnosis much more reliable, especially when you need to correlate a vibration anomaly with a possible foundation settlement.
4. Wireless versus wired, why wireless is winning on retrofit projects
Cabled systems were the historical gold standard, but they are now impractical for retrofit projects on aging bridges. Installation costs and traffic disruption have become too high to justify. Wireless systems based on LoRaWAN sub-GHz radio offer a typical line-of-sight range of 1 km, multi-year battery autonomy, and plug-and-play deployment without trenching. With this kind of setup, a network of 30 wireless sensors on a multi-span bridge can be installed and commissioned in a few days, which makes a continuous monitoring program economically viable even on secondary roads.
At Move, our position is that the wireless-versus-wired debate is now mostly settled for retrofit projects. The remaining case for cabled systems is narrow. It covers flagship cable-stayed or suspension bridges where very high sampling rates are required and a cabled backbone was already designed in. For everything else, the wireless route is the better choice on installation cost, install time and total cost of ownership over a 10-year window.
Where to Place Vibration Sensors on a Bridge
Where you put the sensors decides what you can actually measure. The general principle is simple, in that you need at least one sensor at every point where a mode shape has a peak.
For a single-span deck, the mid-span position is the most important location, because it captures the first flexural mode (the bridge bending up and down between its two supports). Quarter-points are needed to identify higher-order modes, specifically the second and third bending modes. Piers and abutments should be instrumented with tiltmeters and triaxial accelerometers to detect foundation movement or scour. Bearings and expansion joints are often the place where local stress concentrations show up first, and for this reason they are high-priority points as well.
A reasonable baseline for a single-span bridge is four to six triaxial accelerometers. For a multi-span structure you should plan eight or more, depending on the asymmetry of the spans and the access constraints. The detailed sensor layout per bridge typology is described in the Move Solutions bridge monitoring solution.
How Real-Time Alerts Actually Work
Storing data without acting on it is the most common failure mode of a monitoring program. The notification side of the system is what turns it from a logbook into a diagnostic tool, and in practice there are three flavours of alert that matter.
The simplest is the static threshold. A PPV reading above a fixed limit in mm/s, or an acceleration above a fixed limit in mm/s², triggers an immediate alarm. This is what compliance with DIN 4150 or UNI 9916 actually requires, and for short-term construction monitoring it is often the only logic worth configuring.
Modal drift is the more diagnostic family. Here the system compares the current natural frequencies of the bridge with a baseline established during the first months of monitoring, and a variation of more than 2 to 3 percent is usually classified as a warning, while more than 5 percent becomes an alarm. This is the alert that flags cracking or fatigue weeks, or even months, before any other indicator becomes visible. It is also the most prone to false positives if the baseline is bad.
Combining the two with environmental signals (temperature, traffic load, humidity) gives multi-parameter logic. Real bridges drift in frequency on a daily and seasonal cycle, so a modal-drift alarm in isolation would generate noise. To get to a genuine structural anomaly, you condition the alert on ambient temperature being within range, or on the PPV crossing its own threshold at the same time.
Across our deployments, we have come to a position that is unpopular with sales pages. Do not enable SMS-tier alarms during the baseline period, even when the platform technically allows them from day one. The baseline phase usually takes 30 to 90 days, and one false alarm at 3am to an asset manager's phone burns more credibility than three months of accurate readings build. Once the baseline is consolidated, alerts can be routed via SMS, email or webhook into the Bridge Management System used by the agency. In MyMove, thresholds can also be reconfigured remotely without on-site intervention.
Standards and Regulations You Need to Know
The standards picture for an asset manager working on an international portfolio is fragmented, because different rules apply in different jurisdictions. To run a serious monitoring program, you have to map onto the right framework from day one. Here are the ones that matter most.
StandardRegionScopeDIN 4150-3Germany / EUPPV limits for damage prevention on structuresUNI 9916ItalyMeasurement of construction-induced vibrationBS 7385United KingdomVibration on buildings and structuresAASHTO LRFDUnited StatesServiceability, deflection limits, peak accelerationFHWA NBISUnited StatesNational Bridge Inspection StandardsMIT 2020 / NTC 2018ItalyRisk classification and multi-level monitoring (Dec 2026 deadline)
For Italian public asset managers, the MIT 2020 Guidelines deadline of December 2026 is the most pressing concern. The full compliance pathway is described in the Move Solutions article on Italian structural monitoring regulations, NTC 2018 and the MIT Guidelines 2020.
Real-World Case Studies
The Chetwynd Bridge in Staffordshire is the largest surviving pre-1830s cast-iron bridge in England, Grade I listed and notoriously sensitive to invasive instrumentation. A wireless system tracked its structural behaviour during the restoration without touching the historic ironwork. Chetwynd Bridge case study.
The Bridge of the Gods, in Cascade Locks, Oregon, is a historic cantilever crossing of the Columbia River. In partnership with Parsons, Move deployed a wireless SHM system that captures real-time data on stress, vibration and movement. The instrumentation is unusual for a US heritage crossing, where the standard practice is still episodic monitoring rather than continuous instrumentation. Parsons is using the data both to inform the long-term preservation plan and to schedule maintenance cycles against actual structural behaviour rather than against the calendar. Over the next decade, we expect this kind of operating model (calendar-driven maintenance giving way to data-driven maintenance) to become standard across US heritage bridge management. Bridge of the Gods case study.
The Zambeccari Bridge in Pontremoli, Tuscany, is an early-1900s reinforced concrete crossing of the Verde stream. Closed in May 2020 for structural concerns, it was reopened with a reduced carriageway once Vega Engineering specified a continuous remote monitoring system based on Move sensors. Zambeccari Bridge case study.
How to Build a Continuous Bridge Vibration Monitoring Program in 5 Steps
- Risk-assess your portfolio. Identify which bridges require continuous monitoring based on age, traffic load, criticality and applicable attention class. In Italy this means using the level-2 classification of the MIT 2020 multi-level approach. In the United States it means cross-referencing the NBI rating.
- Define your KPIs. Decide whether the program is compliance-driven (PPV thresholds linked to DIN 4150 or UNI 9916) or safety-driven (modal frequency tracking and deflection trends). What you choose here determines the sensor mix.
- Design the sensor layout. Decide how many sensors you need, where to put them and which technologies to mix. Six triaxial accelerometers plus two tiltmeters is a reasonable starting point for a single-span structure.
- Establish a baseline of 30 to 90 days. Do not skip this step, because without a baseline every alert risks becoming a false positive, and the system loses its diagnostic value.
- Configure alerts and integrate with your Bridge Management System. Decide who receives which alerts, what the escalation looks like, and how automated reporting feeds into the workflow your team already uses.
Frequently Asked Questions
Does Move recommend monitoring all bridges in a portfolio, or only some?Only some. Above a certain age and traffic exposure, every structure becomes a candidate, but the budget should focus where the consequence of failure is highest. That means critical traffic links, single-route crossings and structures with no network redundancy. In Italy, it also means concentrating on bridges in the higher attention classes of the MIT 2020 framework. For low-traffic structures with redundant alternatives, periodic or post-event monitoring is usually a better use of the same money.
When does it NOT make sense to deploy continuous monitoring?There are three cases where we tell clients to wait. The most common is a bridge scheduled for replacement within 24 months, because the data simply will not pay back during the remaining service life. We also pass on installations where the asset owner has not yet built an internal workflow for handling alerts, since without an escalation chain the platform produces noise instead of diagnostic value. The third case is harder to call out diplomatically. A compliance-driven program specified on a structurally sound bridge, just to tick a regulatory box, tends to benefit the engineer commissioning the instrumentation more than the structure being monitored.
Why do most first-time monitoring programs lose credibility with the asset owner?Almost always for the same reason. Alerts before baseline. The platform technically allows SMS alarms from day one, but during the first 30 to 90 days the system has not yet learned what "normal" looks like for that specific bridge. So it fires on temperature swings, on a particularly heavy lorry, on a thunderstorm. The asset manager gets three false alarms in a fortnight, stops trusting the system, and the program is dead before the baseline has even consolidated.
Can wireless sensors really replace wired systems on critical infrastructure?For most use cases, yes. Modern wireless SHM systems based on LoRaWAN have multi-year battery autonomy, a sub-GHz range of about 1 km, and they provide time-synchronisation accuracy that is sufficient for modal analysis. Wired systems still have a role on flagship bridges that require very high sampling rates, or where a cabled backbone is already in place.
How long does a bridge vibration monitoring system take to install?A typical wireless deployment of 6 to 12 sensors on a single-span bridge can be installed and commissioned in one to three days. A multi-span installation with 30 or more sensors usually takes one week.
What are the typical PPV thresholds for bridge structures?PPV limits depend on the applicable standard and on the type of structure. As a reference, historic buildings are typically limited to 2 to 5 mm/s, modern residential structures to 5 to 15 mm/s, and industrial structures to 15 to 50 mm/s. Bridge-specific limits should be defined together with the structural engineer, based on the bridge typology and the type of vibration source.
Does vibration monitoring comply with FHWA NBIS requirements?Vibration monitoring is a supplement to the visual inspection regime mandated by FHWA NBIS, not a replacement for it. It strengthens the inspection program by providing continuous data between one biennial inspection and the next, and it is increasingly recognised as a best practice by State DOTs.
Where to Begin
The fastest way to scope a vibration monitoring program is to talk to a Move engineer about the specific bridges you have in mind, the standard you need to map onto, and the alert workflow your team can realistically commit to. A 20-minute conversation on the MyMove demo covers more ground than a week of reading datasheets. If you would rather come in already briefed, the bridge monitoring brochure covers sensor configurations across bridge typologies.
Other articles
Subscribe to Updates
Stay informed about our latest innovations and insights.